RBS 2005 Annual Report Download - page 73
Download and view the complete annual report
Please find page 73 of the 2005 RBS annual report below. You can navigate through the pages in the report by either clicking on the pages listed below, or by using the keyword search tool below to find specific information within the annual report.-
 1
1 -
2
-
3
-
4
-
5
-
6
-
7
-
8
-
9
-
10
-
11
-
12
-
13
-
14
-
15
-
16
-
17
-
18
-
19
-
20
-
21
-
22
-
23
-
24
-
25
-
26
-
27
-
28
-
29
-
30
-
31
-
32
-
33
-
34
-
35
-
36
-
37
-
38
-
39
-
40
-
41
-
42
-
43
-
44
-
45
-
46
-
47
-
48
-
49
-
50
-
51
-
52
-
53
-
54
-
55
-
56
-
57
-
58
-
59
-
60
-
61
-
62
-
 63
63 -
 64
64 -
 65
65 -
 66
66 -
 67
67 -
 68
68 -
 69
69 -
 70
70 -
 71
71 -
 72
72 -
 73
73 -
 74
74 -
 75
75 -
 76
76 -
 77
77 -
 78
78 -
 79
79 -
 80
80 -
 81
81 -
 82
82 -
 83
83 -
84
-
85
-
86
-
87
-
88
-
89
-
90
-
91
-
92
-
93
-
94
-
95
-
96
-
97
-
98
-
99
-
100
-
101
-
102
-
103
-
104
-
105
-
106
-
107
-
108
-
109
-
110
-
111
-
112
-
113
-
114
-
115
-
116
-
117
-
118
-
119
-
120
-
121
-
122
-
123
-
124
-
125
-
126
-
127
-
128
-
129
-
130
-
131
-
132
-
133
-
134
-
135
-
136
-
137
-
138
-
139
-
140
-
141
-
142
-
143
-
144
-
145
-
146
-
147
-
148
-
149
-
150
-
151
-
152
-
153
-
154
-
155
-
156
-
157
-
158
-
159
-
160
-
161
-
162
-
163
-
164
-
165
-
166
-
167
-
168
-
169
-
170
-
171
-
172
-
173
-
174
-
175
-
176
-
177
-
178
-
179
-
180
-
181
-
182
-
183
-
184
-
185
-
186
-
187
-
188
-
189
-
190
-
191
-
192
-
193
-
194
-
195
-
196
-
197
-
198
-
199
-
200
-
201
-
202
-
203
-
204
-
205
-
206
-
207
-
208
-
209
-
210
-
211
-
212
-
213
-
214
-
215
-
216
-
217
-
218
-
219
-
220
-
221
-
222
-
223
-
224
-
225
-
226
-
227
-
228
-
229
-
230
-
231
-
232
-
233
-
234
-
235
-
236
-
237
-
238
-
239
-
240
-
241
-
242
-
243
-
244
-
245
-
246
-
247
-
248
-
249
-
250
-
251
-
252
-
253
-
254
-
255
-
256
-
257
-
258
-
259
-
260
-
261
-
262
-
263
-
264
-
265
-
266
-
267
-
268
-
269
-
270
-
271
-
272
 |
 |

section
01
Operating and
financial review
71
Operating and financial review
Annual Report and Accounts 2005
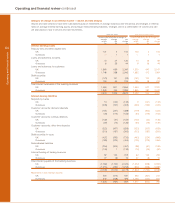
Corporate Markets – Mid-Corporate and Commercial
Pro forma
2005 2004
£m £m
Net interest income 1,760 1,607
Non-interest income 1,257 1,171
Total income 3,017 2,778
Direct expenses
– staff costs 529 489
– other 132 123
– operating lease depreciation 335 322
996 934
Contribution before impairment losses 2,021 1,844
Impairment losses 218 277
Contribution 1,803 1,567
31 December 1 January
2005 2005
£bn £bn
Total assets* 70.4 61.6
Loans and advances to customers – gross* 67.9 59.4
Customer deposits* 60.0 51.8
Weighted risk assets 74.2 65.6
* excluding repos and reverse repos
Corporate Markets generated good results in the Mid-Corporate
& Commercial customer segment in 2005, building on the
strength of its UK franchise. We maintained our market-leading
positions in corporate and commercial banking, asset finance
and invoice finance. Total income rose by 9% to £3,017 million,
whilst contribution rose by 15% to £1,803 million.
Net interest income increased 10% to £1,760 million as a result
of strong growth in average lending, up £7.7 billion, or 16%
and in average customer deposits, up £5.1 billion, or 12%.
Average interest-bearing deposits grew particularly strongly.
Non-interest income rose by 7% to £1,257 million, reflecting
our success in cross-selling our full range of products and
services to customers. Our business has benefited from the
co-location of our Lombard and Invoice Finance managers
with our corporate and commercial banking operations.
Expense growth, excluding operating lease depreciation,
was 8% which included a further investment in customer-
facing staff.
Impairment losses were 21% lower than in 2004 at
£218 million, reflecting a further improvement in our strong
credit metrics.