RBS 2005 Annual Report Download - page 98
Download and view the complete annual report
Please find page 98 of the 2005 RBS annual report below. You can navigate through the pages in the report by either clicking on the pages listed below, or by using the keyword search tool below to find specific information within the annual report.-
 1
1 -
2
-
3
-
4
-
5
-
6
-
7
-
8
-
9
-
10
-
11
-
12
-
13
-
14
-
15
-
16
-
17
-
18
-
19
-
20
-
21
-
22
-
23
-
24
-
25
-
26
-
27
-
28
-
29
-
30
-
31
-
32
-
33
-
34
-
35
-
36
-
37
-
38
-
39
-
40
-
41
-
42
-
43
-
44
-
45
-
46
-
47
-
48
-
49
-
50
-
51
-
52
-
53
-
54
-
55
-
56
-
57
-
58
-
59
-
60
-
61
-
62
-
63
-
64
-
65
-
66
-
67
-
68
-
69
-
70
-
71
-
72
-
73
-
74
-
75
-
76
-
77
-
78
-
79
-
80
-
81
-
82
-
83
-
84
-
85
-
86
-
87
-
 88
88 -
 89
89 -
 90
90 -
 91
91 -
 92
92 -
 93
93 -
 94
94 -
 95
95 -
 96
96 -
 97
97 -
 98
98 -
 99
99 -
 100
100 -
 101
101 -
 102
102 -
 103
103 -
 104
104 -
 105
105 -
 106
106 -
 107
107 -
 108
108 -
109
-
110
-
111
-
112
-
113
-
114
-
115
-
116
-
117
-
118
-
119
-
120
-
121
-
122
-
123
-
124
-
125
-
126
-
127
-
128
-
129
-
130
-
131
-
132
-
133
-
134
-
135
-
136
-
137
-
138
-
139
-
140
-
141
-
142
-
143
-
144
-
145
-
146
-
147
-
148
-
149
-
150
-
151
-
152
-
153
-
154
-
155
-
156
-
157
-
158
-
159
-
160
-
161
-
162
-
163
-
164
-
165
-
166
-
167
-
168
-
169
-
170
-
171
-
172
-
173
-
174
-
175
-
176
-
177
-
178
-
179
-
180
-
181
-
182
-
183
-
184
-
185
-
186
-
187
-
188
-
189
-
190
-
191
-
192
-
193
-
194
-
195
-
196
-
197
-
198
-
199
-
200
-
201
-
202
-
203
-
204
-
205
-
206
-
207
-
208
-
209
-
210
-
211
-
212
-
213
-
214
-
215
-
216
-
217
-
218
-
219
-
220
-
221
-
222
-
223
-
224
-
225
-
226
-
227
-
228
-
229
-
230
-
231
-
232
-
233
-
234
-
235
-
236
-
237
-
238
-
239
-
240
-
241
-
242
-
243
-
244
-
245
-
246
-
247
-
248
-
249
-
250
-
251
-
252
-
253
-
254
-
255
-
256
-
257
-
258
-
259
-
260
-
261
-
262
-
263
-
264
-
265
-
266
-
267
-
268
-
269
-
270
-
271
-
272
 |
 |

96
Operating and financial review
Operating and financial review continued
Liquidity risk
Liquidity risk management within the Group focuses on both
overall balance sheet structure and the day-to-day control,
within prudent limits, of risk arising from the mismatch of
maturities across the balance sheet and from undrawn
commitments and other contingent obligations.
The management of liquidity risk within the Group is
undertaken within limits and other policy parameters set by
GALCO, which reviews monthly, and receives on an exception
basis, reports detailing compliance with those policy
parameters. A weekly report is also provided to the Group’s
executive management. Compliance is monitored and co-
ordinated daily under the stewardship of the Group Treasury
function, both in respect of internal policy and the regulatory
requirements of the Financial Services Authority.
Detailed liquidity position reports are compiled each day by
Group Treasury and reviewed daily and weekly with Financial
Markets, who manage day-to-day and intra-day market
execution within the policy parameters set.
In addition to their consolidation within the Group’s daily
liquidity management process, it is also the responsibility of all
Group subsidiaries and branches outside the UK to ensure
compliance with any separate local regulatory liquidity
requirements where applicable, subject to Group Treasury
oversight.
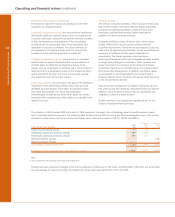
2005 2004
Sources of funding £m % £m %
Customer accounts (excluding repos)
Repayable on demand 172,853 27 169,016 32
Time deposits 121,260 19 72,165 14
Total customer accounts (excluding repos) 294,113 46 241,181 46
Debt securities over 1 year remaining maturity 22,293 3 9,931 2
Subordinated liabilities 28,274 4 20,366 4
Shareholders’ equity 35,435 6 33,905 6
380,115 59 305,383 58
Debt securities up to 1 year remaining maturity 68,127 11 54,068 10
Repo agreements with customers 48,754 7 42,134 8
Deposits by banks (excluding repos) 62,502 10 56,541 11
Repo agreements with banks 47,905 7 43,342 8
Short positions 37,427 6 28,923 5
Total 644,830 100 530,391 100
Diversification of funding sources
The structure of the Group’s balance sheet is managed to maintain substantial diversification, to minimise concentration across its
various deposit sources, and to contain the level of reliance on total and net short-term wholesale sources of funds within prudent
levels. As part of the Group’s planning process, the forecast structure of the balance sheet is regularly reviewed over the plan
horizon and funding strategies and options are developed by Group Treasury and implemented after review and approval by GALCO.
The level of large deposits taken from banks, corporate customers, non-bank financial institutions and other customers, and
significant cash outflows therefrom, are also reviewed regularly to monitor concentration and identify any adverse trends. During
2005 the composition of the Group’s funding sources remained well diversified by counterparty, instrument, market and maturity.
Customer accounts (excluding repos), term debt securities of
over 1 year remaining maturity, subordinated liabilities and
capital continue to represent the core of the Group’s funding.
These core funds in total increased by £74,732 million (24%)
over the course of 2005 to represent 59% of total funding
excluding other liabilities at 31 December 2005.
Customer accounts continue to provide a substantial
proportion of the Group’s funding and comprise a well
diversified and stable source of funds from a wide range of
retail, corporate and non-bank institutional customers.
Excluding repo agreements, customer accounts grew by
£52,932 million (22%), to maintain 46% of total funding
excluding other liabilities at 31 December 2005.
Term debt securities with an outstanding term of over 1 year
increased £12,362 million (124%) to represent 3% of the
Group’s funding at 31 December 2005, reflecting the activity of
the Group in raising term funds through its Euro and US
Medium Term Note and securitisation programmes.
Capital (shareholders’ equity and subordinated debt) increased
by £9,438 million (17%) and provides around 10% of total
funding excluding other liabilities.