RBS 2005 Annual Report Download - page 96
Download and view the complete annual report
Please find page 96 of the 2005 RBS annual report below. You can navigate through the pages in the report by either clicking on the pages listed below, or by using the keyword search tool below to find specific information within the annual report.-
 1
1 -
2
-
3
-
4
-
5
-
6
-
7
-
8
-
9
-
10
-
11
-
12
-
13
-
14
-
15
-
16
-
17
-
18
-
19
-
20
-
21
-
22
-
23
-
24
-
25
-
26
-
27
-
28
-
29
-
30
-
31
-
32
-
33
-
34
-
35
-
36
-
37
-
38
-
39
-
40
-
41
-
42
-
43
-
44
-
45
-
46
-
47
-
48
-
49
-
50
-
51
-
52
-
53
-
54
-
55
-
56
-
57
-
58
-
59
-
60
-
61
-
62
-
63
-
64
-
65
-
66
-
67
-
68
-
69
-
70
-
71
-
72
-
73
-
74
-
75
-
76
-
77
-
78
-
79
-
80
-
81
-
82
-
83
-
84
-
85
-
 86
86 -
 87
87 -
 88
88 -
 89
89 -
 90
90 -
 91
91 -
 92
92 -
 93
93 -
 94
94 -
 95
95 -
 96
96 -
 97
97 -
 98
98 -
 99
99 -
 100
100 -
 101
101 -
 102
102 -
 103
103 -
 104
104 -
 105
105 -
 106
106 -
107
-
108
-
109
-
110
-
111
-
112
-
113
-
114
-
115
-
116
-
117
-
118
-
119
-
120
-
121
-
122
-
123
-
124
-
125
-
126
-
127
-
128
-
129
-
130
-
131
-
132
-
133
-
134
-
135
-
136
-
137
-
138
-
139
-
140
-
141
-
142
-
143
-
144
-
145
-
146
-
147
-
148
-
149
-
150
-
151
-
152
-
153
-
154
-
155
-
156
-
157
-
158
-
159
-
160
-
161
-
162
-
163
-
164
-
165
-
166
-
167
-
168
-
169
-
170
-
171
-
172
-
173
-
174
-
175
-
176
-
177
-
178
-
179
-
180
-
181
-
182
-
183
-
184
-
185
-
186
-
187
-
188
-
189
-
190
-
191
-
192
-
193
-
194
-
195
-
196
-
197
-
198
-
199
-
200
-
201
-
202
-
203
-
204
-
205
-
206
-
207
-
208
-
209
-
210
-
211
-
212
-
213
-
214
-
215
-
216
-
217
-
218
-
219
-
220
-
221
-
222
-
223
-
224
-
225
-
226
-
227
-
228
-
229
-
230
-
231
-
232
-
233
-
234
-
235
-
236
-
237
-
238
-
239
-
240
-
241
-
242
-
243
-
244
-
245
-
246
-
247
-
248
-
249
-
250
-
251
-
252
-
253
-
254
-
255
-
256
-
257
-
258
-
259
-
260
-
261
-
262
-
263
-
264
-
265
-
266
-
267
-
268
-
269
-
270
-
271
-
272
 |
 |

94
Operating and financial review
Impairment loss provision methodology
Provisions for impairment losses are assessed under three
categories as described below:
Individually assessed provisions are the provisions required for
individually significant impaired assets which are assessed on
a case by case basis, taking into account the financial condition
of the counterparty and any guarantor. This incorporates
an estimate of the discounted value of any recoveries and
realisation of security or collateral. The asset continues to
be assessed on an individual basis until it is repaid in full,
transferred to the performing portfolio or written-off.
Collectively assessed provisions are provisions on impaired
credits below an agreed threshold which are assessed on a
portfolio basis, to reflect the homogeneous nature of the
assets, such as credit cards or personal loans. The provision is
determined from a quantitative review of the relevant portfolio,
taking account of the level of arrears, security and average
loss experience over the recovery period.
Latent loss provisions are provisions held against the estimated
impairment in the performing portfolio which have yet to be
identified as at the balance sheet date. To assess the latent
loss within the portfolios, the Group has developed
methodologies to estimate the time that an asset can remain
impaired within a performing portfolio before it is identified and
reported as such.
Provision analysis
The Group’s consumer portfolios, which consist of small value,
high volume credits, have highly efficient largely automated
processes for identifying problem credits and very short
timescales, typically three months, before resolution or
adoption of various recovery methods.
Corporate portfolios consist of higher value, lower volume
credits, which tend to be structured to meet individual
customer requirements. Provisions are assessed on a case by
case basis by experienced specialists, as well as professional
valuations of collateral and the expert judgement of
accountants. The Group operates a clear provisions
governance framework which sets thresholds whereby suitable
oversight and challenge is undertaken. These opinions and
levels of provision are overseen by the division’s Provision
Committee chaired by its Chief Executive, with representation
from Group Risk Management. In addition, significant cases
are presented to, and challenged by, the Group Problem
Exposure Review Forum chaired by the Group Chief Executive
or the Group Finance Director.
Early and active management of problem exposures ensures
that credit losses are minimised. Specialised units are used for
different customer types to ensure that the appropriate risk
mitigation is taken in a timely manner.
Portfolio provisions are reassessed regularly as part of the
Group’s ongoing monitoring process.
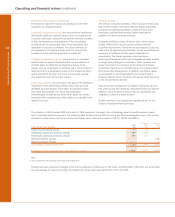
Pro forma Statutory
2005 2004 2004
Loan impairment charge £m £m £m
Latent loss provisions charge 14 75
Collectively assessed provisions charge 1,399 1,059
Individually assessed provisions charge 290 373
Specific provision charge 1,386
General provision charge 16
Total charge to income statement 1,703 1,507 1,402
Charge as a % of customer loans and advances – gross(1) 0.46% 0.47% 0.47%
Operating and financial review continued
Notes:
(1) Gross of provisions and excluding reverse repurchase agreements.
Provisions for loan impairment charged to the income statement in 2005 were £1,703 million, up £196 million (13%) from pro forma 2004.
As a percentage of customer lending, the impairment charge improved slightly from 0.47% to 0.46%.
The adoption of IAS 39 under IFRS at the start of 2005 resulted in changes to the methodology used to identify impaired assets
and to calculate required provisions. The following table therefore shows 2004 on both a pro forma and statutory basis. Commentary
is based on comparisons with the pro forma information which reflects the impact of IAS 32, IAS 39 and IFRS 4.