RBS 2005 Annual Report Download - page 86
Download and view the complete annual report
Please find page 86 of the 2005 RBS annual report below. You can navigate through the pages in the report by either clicking on the pages listed below, or by using the keyword search tool below to find specific information within the annual report.-
 1
1 -
2
-
3
-
4
-
5
-
6
-
7
-
8
-
9
-
10
-
11
-
12
-
13
-
14
-
15
-
16
-
17
-
18
-
19
-
20
-
21
-
22
-
23
-
24
-
25
-
26
-
27
-
28
-
29
-
30
-
31
-
32
-
33
-
34
-
35
-
36
-
37
-
38
-
39
-
40
-
41
-
42
-
43
-
44
-
45
-
46
-
47
-
48
-
49
-
50
-
51
-
52
-
53
-
54
-
55
-
56
-
57
-
58
-
59
-
60
-
61
-
62
-
63
-
64
-
65
-
66
-
67
-
68
-
69
-
70
-
71
-
72
-
73
-
74
-
75
-
 76
76 -
 77
77 -
 78
78 -
 79
79 -
 80
80 -
 81
81 -
 82
82 -
 83
83 -
 84
84 -
 85
85 -
 86
86 -
 87
87 -
 88
88 -
 89
89 -
 90
90 -
 91
91 -
 92
92 -
 93
93 -
 94
94 -
 95
95 -
 96
96 -
97
-
98
-
99
-
100
-
101
-
102
-
103
-
104
-
105
-
106
-
107
-
108
-
109
-
110
-
111
-
112
-
113
-
114
-
115
-
116
-
117
-
118
-
119
-
120
-
121
-
122
-
123
-
124
-
125
-
126
-
127
-
128
-
129
-
130
-
131
-
132
-
133
-
134
-
135
-
136
-
137
-
138
-
139
-
140
-
141
-
142
-
143
-
144
-
145
-
146
-
147
-
148
-
149
-
150
-
151
-
152
-
153
-
154
-
155
-
156
-
157
-
158
-
159
-
160
-
161
-
162
-
163
-
164
-
165
-
166
-
167
-
168
-
169
-
170
-
171
-
172
-
173
-
174
-
175
-
176
-
177
-
178
-
179
-
180
-
181
-
182
-
183
-
184
-
185
-
186
-
187
-
188
-
189
-
190
-
191
-
192
-
193
-
194
-
195
-
196
-
197
-
198
-
199
-
200
-
201
-
202
-
203
-
204
-
205
-
206
-
207
-
208
-
209
-
210
-
211
-
212
-
213
-
214
-
215
-
216
-
217
-
218
-
219
-
220
-
221
-
222
-
223
-
224
-
225
-
226
-
227
-
228
-
229
-
230
-
231
-
232
-
233
-
234
-
235
-
236
-
237
-
238
-
239
-
240
-
241
-
242
-
243
-
244
-
245
-
246
-
247
-
248
-
249
-
250
-
251
-
252
-
253
-
254
-
255
-
256
-
257
-
258
-
259
-
260
-
261
-
262
-
263
-
264
-
265
-
266
-
267
-
268
-
269
-
270
-
271
-
272
 |
 |

84
Operating and financial review
Operating and financial review continued
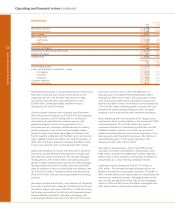
Cash flow
2005 2004
£m £m
Net cash flows from operating activities 8,950 2,493
Net cash flows from investing activities (2,612) (9,398)
Net cash flows from financing activities (703) 7,119
Effects of exchange rate changes on cash and cash equivalents (3,107) 1,686
Net increase in cash and cash equivalents 2,528 1,900
2005
The major factors contributing to the net cash inflow of £8,950
million from operating activities in 2005 were the profit before
tax of £7,936 million, increases in deposits and debt securities
in issue of £56,571 million, and increases in short positions
and settlement balances of £10,326 million, partially offset by
increases in securities of £28,842 million and increases in
loans and advances of £36,778 million.
Net purchases of fixed assets of £2,592 million, including
operating lease assets and computer and other equipment,
were the main contributors to the net cash outflow from
investing activities of £2,612 million.
The issue of £1,649 million preference shares and £1,234
million subordinated debt were more than offset by dividend
payments of £2,007 million and the repayment of £1,553
million of subordinated liabilities, resulting in a net cash outflow
from financing activities of £703 million.
2004
The major factors contributing to the net cash inflow of £2,493
million from operating activities in 2004 were the profit before
tax of £7,284 million, increases in deposits and debt securities
in issue of £72,146 million, and increases in short positions
and settlement balances of £8,796, partially offset by
increases in securities of £11,883 million and increase in loans
and advances of £72,955 million.
Net purchases of fixed assets of £2,662 million, including
operating lease assets and computer and other equipment,
and net investment in business interests and intangible assets
of £7,968 million led to the net cash outflow from investing
activities of £9,398 million.
The issue of £1,358 million preference shares and £2,845 million
ordinary shares, and £4,624 million subordinated liabilities,
partly offset by the payment of £1,635 million of dividends,
were the main contributors to the net cash inflow from financing
activities of £7,119 million.