RBS 2005 Annual Report Download - page 76
Download and view the complete annual report
Please find page 76 of the 2005 RBS annual report below. You can navigate through the pages in the report by either clicking on the pages listed below, or by using the keyword search tool below to find specific information within the annual report.-
 1
1 -
2
-
3
-
4
-
5
-
6
-
7
-
8
-
9
-
10
-
11
-
12
-
13
-
14
-
15
-
16
-
17
-
18
-
19
-
20
-
21
-
22
-
23
-
24
-
25
-
26
-
27
-
28
-
29
-
30
-
31
-
32
-
33
-
34
-
35
-
36
-
37
-
38
-
39
-
40
-
41
-
42
-
43
-
44
-
45
-
46
-
47
-
48
-
49
-
50
-
51
-
52
-
53
-
54
-
55
-
56
-
57
-
58
-
59
-
60
-
61
-
62
-
63
-
64
-
65
-
 66
66 -
 67
67 -
 68
68 -
 69
69 -
 70
70 -
 71
71 -
 72
72 -
 73
73 -
 74
74 -
 75
75 -
 76
76 -
 77
77 -
 78
78 -
 79
79 -
 80
80 -
 81
81 -
 82
82 -
 83
83 -
 84
84 -
 85
85 -
 86
86 -
87
-
88
-
89
-
90
-
91
-
92
-
93
-
94
-
95
-
96
-
97
-
98
-
99
-
100
-
101
-
102
-
103
-
104
-
105
-
106
-
107
-
108
-
109
-
110
-
111
-
112
-
113
-
114
-
115
-
116
-
117
-
118
-
119
-
120
-
121
-
122
-
123
-
124
-
125
-
126
-
127
-
128
-
129
-
130
-
131
-
132
-
133
-
134
-
135
-
136
-
137
-
138
-
139
-
140
-
141
-
142
-
143
-
144
-
145
-
146
-
147
-
148
-
149
-
150
-
151
-
152
-
153
-
154
-
155
-
156
-
157
-
158
-
159
-
160
-
161
-
162
-
163
-
164
-
165
-
166
-
167
-
168
-
169
-
170
-
171
-
172
-
173
-
174
-
175
-
176
-
177
-
178
-
179
-
180
-
181
-
182
-
183
-
184
-
185
-
186
-
187
-
188
-
189
-
190
-
191
-
192
-
193
-
194
-
195
-
196
-
197
-
198
-
199
-
200
-
201
-
202
-
203
-
204
-
205
-
206
-
207
-
208
-
209
-
210
-
211
-
212
-
213
-
214
-
215
-
216
-
217
-
218
-
219
-
220
-
221
-
222
-
223
-
224
-
225
-
226
-
227
-
228
-
229
-
230
-
231
-
232
-
233
-
234
-
235
-
236
-
237
-
238
-
239
-
240
-
241
-
242
-
243
-
244
-
245
-
246
-
247
-
248
-
249
-
250
-
251
-
252
-
253
-
254
-
255
-
256
-
257
-
258
-
259
-
260
-
261
-
262
-
263
-
264
-
265
-
266
-
267
-
268
-
269
-
270
-
271
-
272
 |
 |

74
Operating and financial review
Operating and financial review continued
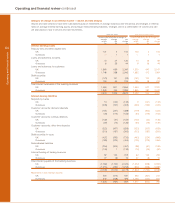
Retail Banking
Pro forma
2005 2004
£m £m
Net interest income 3,175 3,173
Non-interest income 2,258 1,999
Total income 5,433 5,172
Direct expenses
– staff costs 1,026 963
– other 311 329
1,337 1,292
Insurance net claims 486 398
Contribution before impairment losses 3,610 3,482
Impairment losses 601 490
Contribution 3,009 2,992
31 December 1 January
2005 2005
£bn £bn
Total banking assets 77.1 72.8
Loans and advances to customers – gross
– mortgages 47.3 44.1
– personal 13.7 13.2
– business 16.3 15.3
Customer deposits 77.7 71.9
Weighted risk assets 54.0 51.1
Retail Banking produced a stronger performance in the second
half, when it achieved year-on-year income growth of 7%,
compared with 3% in the first half. Total income for 2005
rose by 5% to £5,433 million and contribution by 1% to
£3,009 million. Contribution before impairment losses
increased by 4% to £3,610 million.
Overall customer numbers have increased since December
2004 with personal customers up 274,000 (2%) and registered
internet customers up 30%. During 2005 we continued to
demonstrate our commitment to customer service, with
significant progress in terms of the proportion of our
customers who are “extremely’’ satisfied and we are making
pleasing progress in the current account switcher market.
Among the high street banks, Royal Bank of Scotland ranks
first for customer satisfaction with NatWest now in joint second
place. NatWest remains the number one bank for students. In
2005, 44% of first year students in England and Wales chose
to open new accounts with us compared with 42% in 2004.
Against the backdrop of a slower rate of growth in consumer
borrowing, we have delivered robust growth in average loans
and advances, which increased by 11%. Average mortgage
lending grew by 12% to £46.1 billion, with particularly good
growth in higher margin products such as the offset mortgage.
Average unsecured personal lending, where we took further
steps to enhance our focus on high quality new business, was
up 10% to £13.3 billion. Average customer deposits grew by
6% to £70.9 billion, with particularly good inflows into savings
products.
Net interest income was stronger in the second half, recovering
from a dip in the first half to reach £3,175 million for the full year.
Net interest margin was lower in 2005 than in 2004 but second
half margin was similar to the first half, with increased product
margins offsetting mix effects. Spreads in mortgages and
some savings products improved in the latter part of the year.
Non-interest income rose by 13% to £2,258 million. In
bancassurance, Annualised Premium Equivalent income
increased by 25% to £171 million, with good sales of Child
Trust Funds and portfolio bonds. Excluding bancassurance
premium and other income, non-interest income increased by
11% to £1,567 million, reflecting growth in income from core
personal and small business banking services, and good
progress in our private banking and investment businesses.
Direct expense growth was contained to 3%, despite some
investment in future income initiatives in the second half. Staff
costs increased by 7% to £1,026 million as a result of
continued investment in customer-facing staff with over 500
additional customer advisors in branches, an increase in
telephone banking advisors, and continued expansion of our
bancassurance and investment businesses. We continue to
make efficiency gains in other areas resulting in a 5%
decrease in other costs to £311 million.
Net claims in bancassurance, which under IFRS include
maturities, surrenders and liabilities to policyholders, were
£486 million compared with £398 million in 2004, reflecting
higher levels of bond maturities and increases in liabilities to
policyholders as a result of strong investment returns.
Impairment losses increased by 23% or £111 million to
£601 million. The increased charge principally reflects the
growth in lending over recent years, including 17% growth in
2004. We have taken further steps to refine our credit policy and
improved our recoveries process. Mortgage arrears remain
very low. The average loan-to-value ratio on new mortgages
written in 2005 was 62% and on the stock of mortgages was
46%. Small business credit quality remains stable.