RBS 2005 Annual Report Download - page 157
Download and view the complete annual report
Please find page 157 of the 2005 RBS annual report below. You can navigate through the pages in the report by either clicking on the pages listed below, or by using the keyword search tool below to find specific information within the annual report.-
 1
1 -
2
-
3
-
4
-
5
-
6
-
7
-
8
-
9
-
10
-
11
-
12
-
13
-
14
-
15
-
16
-
17
-
18
-
19
-
20
-
21
-
22
-
23
-
24
-
25
-
26
-
27
-
28
-
29
-
30
-
31
-
32
-
33
-
34
-
35
-
36
-
37
-
38
-
39
-
40
-
41
-
42
-
43
-
44
-
45
-
46
-
47
-
48
-
49
-
50
-
51
-
52
-
53
-
54
-
55
-
56
-
57
-
58
-
59
-
60
-
61
-
62
-
63
-
64
-
65
-
66
-
67
-
68
-
69
-
70
-
71
-
72
-
73
-
74
-
75
-
76
-
77
-
78
-
79
-
80
-
81
-
82
-
83
-
84
-
85
-
86
-
87
-
88
-
89
-
90
-
91
-
92
-
93
-
94
-
95
-
96
-
97
-
98
-
99
-
100
-
101
-
102
-
103
-
104
-
105
-
106
-
107
-
108
-
109
-
110
-
111
-
112
-
113
-
114
-
115
-
116
-
117
-
118
-
119
-
120
-
121
-
122
-
123
-
124
-
125
-
126
-
127
-
128
-
129
-
130
-
131
-
132
-
133
-
134
-
135
-
136
-
137
-
138
-
139
-
140
-
141
-
142
-
143
-
144
-
145
-
146
-
 147
147 -
 148
148 -
 149
149 -
 150
150 -
 151
151 -
 152
152 -
 153
153 -
 154
154 -
 155
155 -
 156
156 -
 157
157 -
 158
158 -
 159
159 -
 160
160 -
 161
161 -
 162
162 -
 163
163 -
 164
164 -
 165
165 -
 166
166 -
 167
167 -
168
-
169
-
170
-
171
-
172
-
173
-
174
-
175
-
176
-
177
-
178
-
179
-
180
-
181
-
182
-
183
-
184
-
185
-
186
-
187
-
188
-
189
-
190
-
191
-
192
-
193
-
194
-
195
-
196
-
197
-
198
-
199
-
200
-
201
-
202
-
203
-
204
-
205
-
206
-
207
-
208
-
209
-
210
-
211
-
212
-
213
-
214
-
215
-
216
-
217
-
218
-
219
-
220
-
221
-
222
-
223
-
224
-
225
-
226
-
227
-
228
-
229
-
230
-
231
-
232
-
233
-
234
-
235
-
236
-
237
-
238
-
239
-
240
-
241
-
242
-
243
-
244
-
245
-
246
-
247
-
248
-
249
-
250
-
251
-
252
-
253
-
254
-
255
-
256
-
257
-
258
-
259
-
260
-
261
-
262
-
263
-
264
-
265
-
266
-
267
-
268
-
269
-
270
-
271
-
272
 |
 |

section
03
Financial
statements
155
Notes on the accounts
Annual Report and Accounts 2005
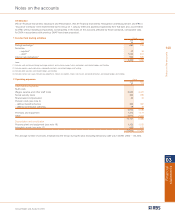
9 Earnings per ordinary share
The earnings per share are based on the following: Group
2005 2004
£m £m
Earnings:
Profit attributable to ordinary shareholders 5,392 4,856
Add back dividends on dilutive convertible non-equity shares 65 66
Diluted earnings attributable to ordinary shareholders 5,457 4,922
Number of shares – millions
Number of ordinary shares:
Weighted average number of ordinary shares in issue during the year 3,183 3,085
Effect of dilutive share options and convertible non-equity shares 60 73
Diluted weighted average number of ordinary shares during the year 3,243 3,158
All convertible preference shares have a dilutive effect in the current year and as such have been included in the computation of
diluted earnings per share. In 2004, $1,500 million of convertible preference shares was not included in the computation of diluted
earnings per share as their effect was anti-dilutive.
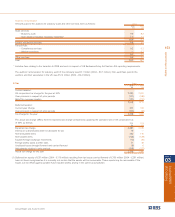
10 Treasury bills and other eligible bills Group
2005 2004
£m £m
Treasury bills and similar securities 5,402 5,538
Other eligible bills 136 572
5,538 6,110
Held-for-trading 3,004
Available-for-sale 2,534
5,538
11 Loans and advances to banks Group Company
2005 2004 2005 2004
£m £m £m £m
Held-for-trading 44,965 —
Designated as at fair value through profit or loss 282 —
Loans and receivables 25,340 9,122
70,587 61,073 9,122 4,106
Amounts above include:
Items in the course of collection from other banks 2,901 2,629
Due from subsidiaries 9,122 4,106
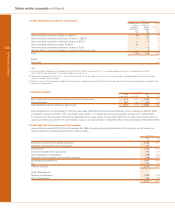
12 Loans and advances to customers Group Company
2005 2004 2005 2004
£m £m £m £m
Held-for-trading 53,963 —
Designated as at fair value through profit or loss 616 —
Loans and receivables 350,960 567
Finance leases 11,687 —
417,226 347,251 567 305
Amounts above include:
Due from subsidiaries 567 305
Subordinated advances 220 —