RBS 2005 Annual Report Download - page 229
Download and view the complete annual report
Please find page 229 of the 2005 RBS annual report below. You can navigate through the pages in the report by either clicking on the pages listed below, or by using the keyword search tool below to find specific information within the annual report.-
 1
1 -
2
-
3
-
4
-
5
-
6
-
7
-
8
-
9
-
10
-
11
-
12
-
13
-
14
-
15
-
16
-
17
-
18
-
19
-
20
-
21
-
22
-
23
-
24
-
25
-
26
-
27
-
28
-
29
-
30
-
31
-
32
-
33
-
34
-
35
-
36
-
37
-
38
-
39
-
40
-
41
-
42
-
43
-
44
-
45
-
46
-
47
-
48
-
49
-
50
-
51
-
52
-
53
-
54
-
55
-
56
-
57
-
58
-
59
-
60
-
61
-
62
-
63
-
64
-
65
-
66
-
67
-
68
-
69
-
70
-
71
-
72
-
73
-
74
-
75
-
76
-
77
-
78
-
79
-
80
-
81
-
82
-
83
-
84
-
85
-
86
-
87
-
88
-
89
-
90
-
91
-
92
-
93
-
94
-
95
-
96
-
97
-
98
-
99
-
100
-
101
-
102
-
103
-
104
-
105
-
106
-
107
-
108
-
109
-
110
-
111
-
112
-
113
-
114
-
115
-
116
-
117
-
118
-
119
-
120
-
121
-
122
-
123
-
124
-
125
-
126
-
127
-
128
-
129
-
130
-
131
-
132
-
133
-
134
-
135
-
136
-
137
-
138
-
139
-
140
-
141
-
142
-
143
-
144
-
145
-
146
-
147
-
148
-
149
-
150
-
151
-
152
-
153
-
154
-
155
-
156
-
157
-
158
-
159
-
160
-
161
-
162
-
163
-
164
-
165
-
166
-
167
-
168
-
169
-
170
-
171
-
172
-
173
-
174
-
175
-
176
-
177
-
178
-
179
-
180
-
181
-
182
-
183
-
184
-
185
-
186
-
187
-
188
-
189
-
190
-
191
-
192
-
193
-
194
-
195
-
196
-
197
-
198
-
199
-
200
-
201
-
202
-
203
-
204
-
205
-
206
-
207
-
208
-
209
-
210
-
211
-
212
-
213
-
214
-
215
-
216
-
217
-
218
-
 219
219 -
 220
220 -
 221
221 -
 222
222 -
 223
223 -
 224
224 -
 225
225 -
 226
226 -
 227
227 -
 228
228 -
 229
229 -
 230
230 -
 231
231 -
 232
232 -
 233
233 -
 234
234 -
 235
235 -
 236
236 -
 237
237 -
 238
238 -
 239
239 -
240
-
241
-
242
-
243
-
244
-
245
-
246
-
247
-
248
-
249
-
250
-
251
-
252
-
253
-
254
-
255
-
256
-
257
-
258
-
259
-
260
-
261
-
262
-
263
-
264
-
265
-
266
-
267
-
268
-
269
-
270
-
271
-
272
 |
 |
section
03
Financial
statements
227
Notes on the accounts
Annual Report and Accounts 2005
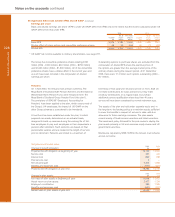
Selected figures in accordance with US GAAP
The following tables summarise the significant adjustments to consolidated net income available for ordinary shareholders and
shareholders’ equity which would result from the application of US GAAP instead of IFRS. Where applicable, the adjustments
are stated gross of tax with the tax effect shown separately in total.
2005 2004
Consolidated statement of income £m £m
Profit attributable to ordinary shareholders – IFRS 5,392 4,856
Adjustments in respect of:
Acquisition accounting —66
Property revaluation and depreciation (90) (65)
Leasehold property provisions (26) (19)
Loan origination 55 (85)
Pension costs (363) (283)
Long-term assurance business 10 (17)
Extinguishment of liabilities — (94)
Financial instruments (556) (628)
Derivatives and hedging (119) 73
Liabilities and equity 74 —
Intangible assets – timing difference (66) (95)
Other (59) (40)
Taxation 223 240
Net income available for ordinary shareholders – US GAAP 4,475 3,909
2005 2004
Consolidated shareholders’ equity £m £m
Shareholders’ equity – IFRS 35,435 33,905
Adjustments in respect of:
Acquisition accounting 517 517
Property revaluation and depreciation (403) (313)
Leasehold property provisions 38 64
Loan origination 614 (373)
Pension costs 145 215
Long-term assurance business (47) (163)
Extinguishment of liabilities — (178)
Financial instruments (259) 76
Derivatives and hedging 260 238
Liabilities and equity 2,298 —
Intangible assets – timing difference 1,919 1,985
Other — 140
Taxation (288) 78
Shareholders’ equity – US GAAP 40,229 36,191
Total assets under US GAAP of £700.4 billion (2004 – £631.1 billion) primarily reflects the effect of certain arrangements that can be
netted under US GAAP, together with the effect of adjustments made to shareholders’ equity.