RBS 2005 Annual Report Download - page 59
Download and view the complete annual report
Please find page 59 of the 2005 RBS annual report below. You can navigate through the pages in the report by either clicking on the pages listed below, or by using the keyword search tool below to find specific information within the annual report.-
 1
1 -
2
-
3
-
4
-
5
-
6
-
7
-
8
-
9
-
10
-
11
-
12
-
13
-
14
-
15
-
16
-
17
-
18
-
19
-
20
-
21
-
22
-
23
-
24
-
25
-
26
-
27
-
28
-
29
-
30
-
31
-
32
-
33
-
34
-
35
-
36
-
37
-
38
-
39
-
40
-
41
-
42
-
43
-
44
-
45
-
46
-
47
-
48
-
 49
49 -
 50
50 -
 51
51 -
 52
52 -
 53
53 -
 54
54 -
 55
55 -
 56
56 -
 57
57 -
 58
58 -
 59
59 -
 60
60 -
 61
61 -
 62
62 -
 63
63 -
 64
64 -
 65
65 -
 66
66 -
 67
67 -
 68
68 -
 69
69 -
70
-
71
-
72
-
73
-
74
-
75
-
76
-
77
-
78
-
79
-
80
-
81
-
82
-
83
-
84
-
85
-
86
-
87
-
88
-
89
-
90
-
91
-
92
-
93
-
94
-
95
-
96
-
97
-
98
-
99
-
100
-
101
-
102
-
103
-
104
-
105
-
106
-
107
-
108
-
109
-
110
-
111
-
112
-
113
-
114
-
115
-
116
-
117
-
118
-
119
-
120
-
121
-
122
-
123
-
124
-
125
-
126
-
127
-
128
-
129
-
130
-
131
-
132
-
133
-
134
-
135
-
136
-
137
-
138
-
139
-
140
-
141
-
142
-
143
-
144
-
145
-
146
-
147
-
148
-
149
-
150
-
151
-
152
-
153
-
154
-
155
-
156
-
157
-
158
-
159
-
160
-
161
-
162
-
163
-
164
-
165
-
166
-
167
-
168
-
169
-
170
-
171
-
172
-
173
-
174
-
175
-
176
-
177
-
178
-
179
-
180
-
181
-
182
-
183
-
184
-
185
-
186
-
187
-
188
-
189
-
190
-
191
-
192
-
193
-
194
-
195
-
196
-
197
-
198
-
199
-
200
-
201
-
202
-
203
-
204
-
205
-
206
-
207
-
208
-
209
-
210
-
211
-
212
-
213
-
214
-
215
-
216
-
217
-
218
-
219
-
220
-
221
-
222
-
223
-
224
-
225
-
226
-
227
-
228
-
229
-
230
-
231
-
232
-
233
-
234
-
235
-
236
-
237
-
238
-
239
-
240
-
241
-
242
-
243
-
244
-
245
-
246
-
247
-
248
-
249
-
250
-
251
-
252
-
253
-
254
-
255
-
256
-
257
-
258
-
259
-
260
-
261
-
262
-
263
-
264
-
265
-
266
-
267
-
268
-
269
-
270
-
271
-
272
 |
 |

section
01
Operating and
financial review
57
Operating and financial review
Annual Report and Accounts 2005
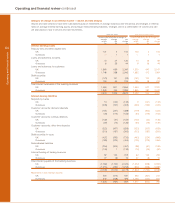
Financial highlights
Pro forma
2005 2004 2004
for the year ended 31 December £m £m £m
Total income (1) 25,569 23,391 22,515
Profit before tax, purchased intangibles amortisation, integration costs and
net gain on sale of strategic investments and subsidiaries 8,251 7,849 7,108
Profit before tax 7,936 7,284 6,543
Profit attributable to ordinary shareholders 5,392 4,856 4,620
Cost:income ratio (%) (2) 41.8% 39.8% 41.8%
Basic earnings per share (pence) 169.4 157.4 149.8
Adjusted earnings per share (pence)(3) 175.9 170.2 162.6
Adjusted after-tax return on equity (%) (4) 18.2% 18.9% 18.5%
1 January
2005 2004 2005
at 31 December £m £m £m
Total assets 776,827 588,122 696,510
Loans and advances to customers 417,226 347,251 381,162
Deposits 453,274 383,198 421,072
Shareholders’ equity 35,435 33,905 30,022
Risk asset ratio – tier 1 (%) 7.6 7.0 6.7
– total (%) 11.7 11.7 11.6
Notes:
(1) Total income for the year ended 31 December 2005 excludes gains on sale of strategic investments and subsidiaries. In the statutory consolidated income statement on page
145, these items are included in total income.
(2) Cost:income ratio represents operating expenses excluding purchased intangibles amortisation, integration costs and loss on sale of subsidiaries, expressed as a percentage of
total income excluding gain on sale of strategic investments and after netting operating lease depreciation against rental income, and excluding acquisitions.
(3) Adjusted earnings per share is based on earnings adjusted for purchased intangibles amortisation, integration costs and net gain on sale of strategic investments and
subsidiaries.
(4) Adjusted after-tax return on equity is based on profit attributable to ordinary shareholders adjusted for purchased intangibles amortisation, integration costs and net gain on sale of
strategic investments and subsidiaries, and average equity shareholders’ funds.
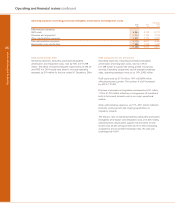
Basis of preparation of pro forma results
In preparing its annual results, the Group has taken advantage of the option in IFRS 1 ‘First-time Adoption of International Financial
Reporting Standards’ to implement IAS 39 ‘Financial Instruments: Recognition and Measurement’ (“IAS 39”), IAS 32 ‘Financial
Instruments: Disclosure and Presentation’ (“IAS 32”) and IFRS 4 ‘Insurance Contracts’ (“IFRS 4”) from 1 January 2005 without
restating its 2004 income statement and balance sheet. However, given the importance of these standards, the Group has provided
detailed pro forma information for the year ended 31 December 2004 reflecting the estimated effect of these standards to facilitate
inter-period comparison. This pro forma information has been prepared on the following basis:
(i) The requirements of IAS 32, IAS 39 and IFRS 4 have been applied from 1 January 2004 except for the requirements relating to
hedge accounting; no hedge ineffectiveness has been recognised in profit or loss.
(ii) Impairment provisions reflect the information and estimates on which previous GAAP provisions were established.
(iii) Classification of financial assets into held-to-maturity, held-for-trading, available-for-sale, loans and receivables or designated as
at fair value through profit or loss at 1 January 2004 is consistent with the approach adopted on 1 January 2005 on implementation
of IAS 39.