RBS 2005 Annual Report Download - page 70
Download and view the complete annual report
Please find page 70 of the 2005 RBS annual report below. You can navigate through the pages in the report by either clicking on the pages listed below, or by using the keyword search tool below to find specific information within the annual report.-
 1
1 -
2
-
3
-
4
-
5
-
6
-
7
-
8
-
9
-
10
-
11
-
12
-
13
-
14
-
15
-
16
-
17
-
18
-
19
-
20
-
21
-
22
-
23
-
24
-
25
-
26
-
27
-
28
-
29
-
30
-
31
-
32
-
33
-
34
-
35
-
36
-
37
-
38
-
39
-
40
-
41
-
42
-
43
-
44
-
45
-
46
-
47
-
48
-
49
-
50
-
51
-
52
-
53
-
54
-
55
-
56
-
57
-
58
-
59
-
 60
60 -
 61
61 -
 62
62 -
 63
63 -
 64
64 -
 65
65 -
 66
66 -
 67
67 -
 68
68 -
 69
69 -
 70
70 -
 71
71 -
 72
72 -
 73
73 -
 74
74 -
 75
75 -
 76
76 -
 77
77 -
 78
78 -
 79
79 -
 80
80 -
81
-
82
-
83
-
84
-
85
-
86
-
87
-
88
-
89
-
90
-
91
-
92
-
93
-
94
-
95
-
96
-
97
-
98
-
99
-
100
-
101
-
102
-
103
-
104
-
105
-
106
-
107
-
108
-
109
-
110
-
111
-
112
-
113
-
114
-
115
-
116
-
117
-
118
-
119
-
120
-
121
-
122
-
123
-
124
-
125
-
126
-
127
-
128
-
129
-
130
-
131
-
132
-
133
-
134
-
135
-
136
-
137
-
138
-
139
-
140
-
141
-
142
-
143
-
144
-
145
-
146
-
147
-
148
-
149
-
150
-
151
-
152
-
153
-
154
-
155
-
156
-
157
-
158
-
159
-
160
-
161
-
162
-
163
-
164
-
165
-
166
-
167
-
168
-
169
-
170
-
171
-
172
-
173
-
174
-
175
-
176
-
177
-
178
-
179
-
180
-
181
-
182
-
183
-
184
-
185
-
186
-
187
-
188
-
189
-
190
-
191
-
192
-
193
-
194
-
195
-
196
-
197
-
198
-
199
-
200
-
201
-
202
-
203
-
204
-
205
-
206
-
207
-
208
-
209
-
210
-
211
-
212
-
213
-
214
-
215
-
216
-
217
-
218
-
219
-
220
-
221
-
222
-
223
-
224
-
225
-
226
-
227
-
228
-
229
-
230
-
231
-
232
-
233
-
234
-
235
-
236
-
237
-
238
-
239
-
240
-
241
-
242
-
243
-
244
-
245
-
246
-
247
-
248
-
249
-
250
-
251
-
252
-
253
-
254
-
255
-
256
-
257
-
258
-
259
-
260
-
261
-
262
-
263
-
264
-
265
-
266
-
267
-
268
-
269
-
270
-
271
-
272
 |
 |

68
Operating and financial review
Operating and financial review continued
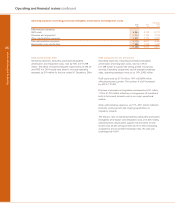
Taxation
Pro forma
2005 2004 2004
£m £m £m
Tax 2,378 1,995 1,856
%%%
UK corporation tax rate 30.0 30.0 30.0
Effective tax rate 30.0 27.4 28.4
The actual tax charge differs from the expected tax charge computed by applying the standard rate of UK corporation tax
as follows:
Pro forma
2005 2004 2004
£m £m £m
Expected tax charge 2,381 2,185 1,963
Interest on subordinated debt not allowable for tax 79 —83
Non-deductible items 230 110 110
Non-taxable items (166) (128) (128)
Taxable foreign exchange movements (10) (10) (10)
Foreign profits taxed at other rates 77 49 49
Unutilised losses – brought forward and carried forward (5) 66
Adjustments in respect of prior periods (208) (217) (217)
Actual tax charge 2,378 1,995 1,856
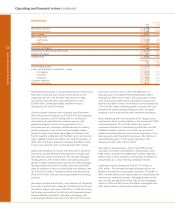
2005 compared with 2004
Impairment losses were £1,707 million compared with
£1,485 million in 2004 with higher provisions in Retail Markets
partly offset by improvements in Corporate Markets. The effect
of implementing the requirements of IAS 39 in 2004 would
have been to increase loan impairment losses by £105 million
for the year ended 31 December 2004.
2005 compared with pro forma 2004
New impairment losses were up 8%, £145 million to
£1,879 million. Recoveries of amounts previously written off
were up £28 million, 19% to £172 million. Consequently the
net charge to the income statement was up £117 million, 7%
to £1,707 million. Improvements in Corporate Markets partly
offset higher impairment losses in Retail Markets.
Loan impairment losses were up from £1,507 million in 2004
to £1,703 million. Other impairment losses were £4 million
compared with £83 million in 2004.
Total balance sheet provisions for impairment amounted to
£3,887 million compared with £4,145 million at 1 January 2005.
Total provision coverage (the ratio of total balance sheet
provisions for impairment to total risk elements in lending)
decreased from 70% to 65%.
The ratio of total balance sheet provisions for impairment to
total risk elements in lending and potential problem loans
decreased to 65% compared with 70% at 1 January 2005.
This reflects amounts written-off and the changing mix from
unsecured to secured exposure.
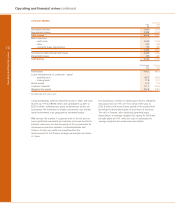
Impairment losses
Pro forma
2005 2004 2004
£m £m £m
New impairment losses 1,879 1,629 1,734
less: recoveries of amounts previously written-off (172) (144) (144)
Charge to income statement 1,707 1,485 1,590
Comprising:
Loan impairment losses 1,703 1,402 1,507
Other impairment losses 4 83 83
Charge to income statement 1,707 1,485 1,590