RBS 2005 Annual Report Download - page 161
Download and view the complete annual report
Please find page 161 of the 2005 RBS annual report below. You can navigate through the pages in the report by either clicking on the pages listed below, or by using the keyword search tool below to find specific information within the annual report.-
 1
1 -
2
-
3
-
4
-
5
-
6
-
7
-
8
-
9
-
10
-
11
-
12
-
13
-
14
-
15
-
16
-
17
-
18
-
19
-
20
-
21
-
22
-
23
-
24
-
25
-
26
-
27
-
28
-
29
-
30
-
31
-
32
-
33
-
34
-
35
-
36
-
37
-
38
-
39
-
40
-
41
-
42
-
43
-
44
-
45
-
46
-
47
-
48
-
49
-
50
-
51
-
52
-
53
-
54
-
55
-
56
-
57
-
58
-
59
-
60
-
61
-
62
-
63
-
64
-
65
-
66
-
67
-
68
-
69
-
70
-
71
-
72
-
73
-
74
-
75
-
76
-
77
-
78
-
79
-
80
-
81
-
82
-
83
-
84
-
85
-
86
-
87
-
88
-
89
-
90
-
91
-
92
-
93
-
94
-
95
-
96
-
97
-
98
-
99
-
100
-
101
-
102
-
103
-
104
-
105
-
106
-
107
-
108
-
109
-
110
-
111
-
112
-
113
-
114
-
115
-
116
-
117
-
118
-
119
-
120
-
121
-
122
-
123
-
124
-
125
-
126
-
127
-
128
-
129
-
130
-
131
-
132
-
133
-
134
-
135
-
136
-
137
-
138
-
139
-
140
-
141
-
142
-
143
-
144
-
145
-
146
-
147
-
148
-
149
-
150
-
 151
151 -
 152
152 -
 153
153 -
 154
154 -
 155
155 -
 156
156 -
 157
157 -
 158
158 -
 159
159 -
 160
160 -
 161
161 -
 162
162 -
 163
163 -
 164
164 -
 165
165 -
 166
166 -
 167
167 -
 168
168 -
 169
169 -
 170
170 -
 171
171 -
172
-
173
-
174
-
175
-
176
-
177
-
178
-
179
-
180
-
181
-
182
-
183
-
184
-
185
-
186
-
187
-
188
-
189
-
190
-
191
-
192
-
193
-
194
-
195
-
196
-
197
-
198
-
199
-
200
-
201
-
202
-
203
-
204
-
205
-
206
-
207
-
208
-
209
-
210
-
211
-
212
-
213
-
214
-
215
-
216
-
217
-
218
-
219
-
220
-
221
-
222
-
223
-
224
-
225
-
226
-
227
-
228
-
229
-
230
-
231
-
232
-
233
-
234
-
235
-
236
-
237
-
238
-
239
-
240
-
241
-
242
-
243
-
244
-
245
-
246
-
247
-
248
-
249
-
250
-
251
-
252
-
253
-
254
-
255
-
256
-
257
-
258
-
259
-
260
-
261
-
262
-
263
-
264
-
265
-
266
-
267
-
268
-
269
-
270
-
271
-
272
 |
 |
section
03
Financial
statements
159
Notes on the accounts
Annual Report and Accounts 2005
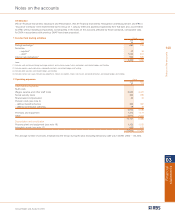
13 Debt securities Group
Bank and
UK Other Other public building Other
government government sector body society issuers Total
2005 £m £m £m £m £m £m
Held-for-trading 4,386 18,073 257 8 57,929 80,653
Designated as at fair value through profit or loss 451 7 — 864 2,669 3,991
Available-for-sale 662 17,807 40 9,613 7,411 35,533
Loans and receivables ————788788
At 31 December 2005 5,499 35,887 297 10,485 68,797 120,965
Available-for-sale
Gross unrealised gains 9 9 — 7 41 66
Gross unrealised losses (7) (277) (1) (6) (64) (355)
2004
Investment securities 757 14,135 309 9,355 10,987 35,543
Other securities 1,866 12,457 37 1,701 42,304 58,365
At 31 December 2004(1) 2,623 26,592 346 11,056 53,291 93,908
Investment securities:
Book value 757 14,135 309 9,355 10,987 35,543
Gross unrecognised gains 2 85 1 5 78 171
Gross unrecognised losses (22) (44) — (4) (285) (355)
Valuation at 31 December 2004 737 14,176 310 9,356 10,780 35,359
(1) Amounts above include subordinated debt securities of £644 million at 31 December 2004.
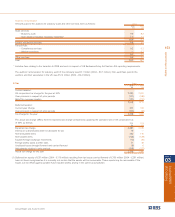
Listed Unlisted Total
2005 £m £m £m
Held-for-trading 41,544 39,109 80,653
Designated as at fair value through profit or loss 3,043 948 3,991
Available-for-sale 34,074 1,459 35,533
Loans and receivables — 788 788
At 31 December 2005 78,661 42,304 120,965
2004
Investment securities 25,647 9,896 35,543
Other securities 30,946 27,419 58,365
At 31 December 2004 56,593 37,315 93,908
The following table shows the Group’s available-for-sale debt securities by remaining maturity and the related yield (based on weighted
averages) as at 31 December 2005.
After 1 but After 5 but
Within 1 year within 5 years within 10 years After 10 years Total
Amount Yield Amount Yield Amount Yield Amount Yield Amount Yield
£m % £m % £m % £m % £m %
UK government 111 7.0 357 5.6 187 5.5 7 2.3 662 5.8
US government, federal agencies and states 52 2.2 292 2.3 829 1.9 14,976 3.6 16,149 3.5
Other government 604 1.9 1,088 4.1 4 5.0 3 4.5 1,699 3.3
Corporate debt securities 640 3.8 1,492 3.9 222 4.7 191 5.1 2,545 4.0
Mortgage-backed securities 27 4.7 13 6.0 511 5.8 3,230 3.6 3,781 3.9
Bank and building society 7,853 4.3 1,567 3.9 156 4.1 37 4.5 9,613 4.3
Other 837 3.1 56 2.8 3 6.8 188 4.8 1,084 3.4
Total fair value 10,124 4.1 4,865 4.0 1,912 3.8 18,632 3.6 35,533 3.8