RBS 2005 Annual Report Download - page 164
Download and view the complete annual report
Please find page 164 of the 2005 RBS annual report below. You can navigate through the pages in the report by either clicking on the pages listed below, or by using the keyword search tool below to find specific information within the annual report.-
 1
1 -
2
-
3
-
4
-
5
-
6
-
7
-
8
-
9
-
10
-
11
-
12
-
13
-
14
-
15
-
16
-
17
-
18
-
19
-
20
-
21
-
22
-
23
-
24
-
25
-
26
-
27
-
28
-
29
-
30
-
31
-
32
-
33
-
34
-
35
-
36
-
37
-
38
-
39
-
40
-
41
-
42
-
43
-
44
-
45
-
46
-
47
-
48
-
49
-
50
-
51
-
52
-
53
-
54
-
55
-
56
-
57
-
58
-
59
-
60
-
61
-
62
-
63
-
64
-
65
-
66
-
67
-
68
-
69
-
70
-
71
-
72
-
73
-
74
-
75
-
76
-
77
-
78
-
79
-
80
-
81
-
82
-
83
-
84
-
85
-
86
-
87
-
88
-
89
-
90
-
91
-
92
-
93
-
94
-
95
-
96
-
97
-
98
-
99
-
100
-
101
-
102
-
103
-
104
-
105
-
106
-
107
-
108
-
109
-
110
-
111
-
112
-
113
-
114
-
115
-
116
-
117
-
118
-
119
-
120
-
121
-
122
-
123
-
124
-
125
-
126
-
127
-
128
-
129
-
130
-
131
-
132
-
133
-
134
-
135
-
136
-
137
-
138
-
139
-
140
-
141
-
142
-
143
-
144
-
145
-
146
-
147
-
148
-
149
-
150
-
151
-
152
-
153
-
 154
154 -
 155
155 -
 156
156 -
 157
157 -
 158
158 -
 159
159 -
 160
160 -
 161
161 -
 162
162 -
 163
163 -
 164
164 -
 165
165 -
 166
166 -
 167
167 -
 168
168 -
 169
169 -
 170
170 -
 171
171 -
 172
172 -
 173
173 -
 174
174 -
175
-
176
-
177
-
178
-
179
-
180
-
181
-
182
-
183
-
184
-
185
-
186
-
187
-
188
-
189
-
190
-
191
-
192
-
193
-
194
-
195
-
196
-
197
-
198
-
199
-
200
-
201
-
202
-
203
-
204
-
205
-
206
-
207
-
208
-
209
-
210
-
211
-
212
-
213
-
214
-
215
-
216
-
217
-
218
-
219
-
220
-
221
-
222
-
223
-
224
-
225
-
226
-
227
-
228
-
229
-
230
-
231
-
232
-
233
-
234
-
235
-
236
-
237
-
238
-
239
-
240
-
241
-
242
-
243
-
244
-
245
-
246
-
247
-
248
-
249
-
250
-
251
-
252
-
253
-
254
-
255
-
256
-
257
-
258
-
259
-
260
-
261
-
262
-
263
-
264
-
265
-
266
-
267
-
268
-
269
-
270
-
271
-
272
 |
 |

162
Notes on the accounts
Notes on the accounts continued
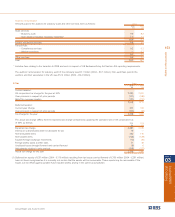
16 Impaired and past-due financial assets Group
Net book
Cost Provision value
2005 £m £m £m
Impaired financial assets
Loans and receivables and finance leases 5,926 3,344 2,582
Available-for-sale 316 132 184
6,242 3,476 2,766
Group
2005 2004
£m £m
Impairment losses charged to the income statement
Loans and receivables and finance leases (see table below) 1,703
Available-for-sale 4
Loans and advances (see table below) 1,402
Amounts written-off fixed asset investments 83
Total 1,707 1,485
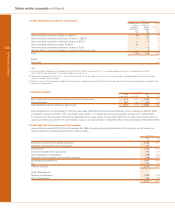
The following table shows impairment losses for loans and receivables and finance leases (2004 – loans and advances).
Group
2004
2005 Specific General Total
£m £m £m £m
At 1 January 4,174 3,332 553 3,885
Implementation of IAS 39 (29) ———
Currency translation and other adjustments 51 (22) (76) (98)
Acquisitions —222 68 290
Amounts written-off (1) (2,040) (1,449) — (1,449)
Recoveries of amounts previously written-off 172 144 — 144
Charged to the income statement 1,703 1,386 16 1,402
Unwind of discount (144) ———
At 31 December (2) 3,887 3,613 561 4,174
(1) Amounts written-off during the year include £2 million relating to banks (2004 – nil).
(2) Balance at 31 December 2005 includes £3 million relating to banks (2004 – £6 million).
Loan impairment
At 31 December 2005, the Group’s non-accrual loans, loans past due 90 days and troubled debt restructurings amounted to £5,937
million (2004 – £5,470 million). Loan impairment provisions of £3,344 million (2004 – £3,561 million) were held against these loans.
Average non-accrual loans, loans past due 90 days and troubled debt restructurings for the year to 31 December 2005 were £5,923
million (2004 – £5,264 million).
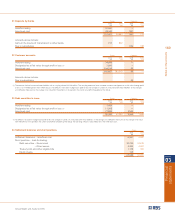
IFRS
2005 2004
£m £m
Gross income not recognised but which would have been
recognised under the original terms of non-accrual and restructured loans
Domestic 334 235
Foreign 62 58
396 293
Interest on non-accrual and restructured loans included in net interest income
Domestic 130 58
Foreign 14 7
144 65