RBS 2005 Annual Report Download - page 67
Download and view the complete annual report
Please find page 67 of the 2005 RBS annual report below. You can navigate through the pages in the report by either clicking on the pages listed below, or by using the keyword search tool below to find specific information within the annual report.-
 1
1 -
2
-
3
-
4
-
5
-
6
-
7
-
8
-
9
-
10
-
11
-
12
-
13
-
14
-
15
-
16
-
17
-
18
-
19
-
20
-
21
-
22
-
23
-
24
-
25
-
26
-
27
-
28
-
29
-
30
-
31
-
32
-
33
-
34
-
35
-
36
-
37
-
38
-
39
-
40
-
41
-
42
-
43
-
44
-
45
-
46
-
47
-
48
-
49
-
50
-
51
-
52
-
53
-
54
-
55
-
56
-
 57
57 -
 58
58 -
 59
59 -
 60
60 -
 61
61 -
 62
62 -
 63
63 -
 64
64 -
 65
65 -
 66
66 -
 67
67 -
 68
68 -
 69
69 -
 70
70 -
 71
71 -
 72
72 -
 73
73 -
 74
74 -
 75
75 -
 76
76 -
 77
77 -
78
-
79
-
80
-
81
-
82
-
83
-
84
-
85
-
86
-
87
-
88
-
89
-
90
-
91
-
92
-
93
-
94
-
95
-
96
-
97
-
98
-
99
-
100
-
101
-
102
-
103
-
104
-
105
-
106
-
107
-
108
-
109
-
110
-
111
-
112
-
113
-
114
-
115
-
116
-
117
-
118
-
119
-
120
-
121
-
122
-
123
-
124
-
125
-
126
-
127
-
128
-
129
-
130
-
131
-
132
-
133
-
134
-
135
-
136
-
137
-
138
-
139
-
140
-
141
-
142
-
143
-
144
-
145
-
146
-
147
-
148
-
149
-
150
-
151
-
152
-
153
-
154
-
155
-
156
-
157
-
158
-
159
-
160
-
161
-
162
-
163
-
164
-
165
-
166
-
167
-
168
-
169
-
170
-
171
-
172
-
173
-
174
-
175
-
176
-
177
-
178
-
179
-
180
-
181
-
182
-
183
-
184
-
185
-
186
-
187
-
188
-
189
-
190
-
191
-
192
-
193
-
194
-
195
-
196
-
197
-
198
-
199
-
200
-
201
-
202
-
203
-
204
-
205
-
206
-
207
-
208
-
209
-
210
-
211
-
212
-
213
-
214
-
215
-
216
-
217
-
218
-
219
-
220
-
221
-
222
-
223
-
224
-
225
-
226
-
227
-
228
-
229
-
230
-
231
-
232
-
233
-
234
-
235
-
236
-
237
-
238
-
239
-
240
-
241
-
242
-
243
-
244
-
245
-
246
-
247
-
248
-
249
-
250
-
251
-
252
-
253
-
254
-
255
-
256
-
257
-
258
-
259
-
260
-
261
-
262
-
263
-
264
-
265
-
266
-
267
-
268
-
269
-
270
-
271
-
272
 |
 |
section
01
Operating and
financial review
65
Operating and financial review
Annual Report and Accounts 2005
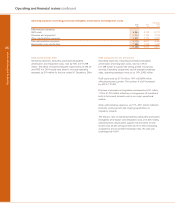
2005 compared with 2004
Non-interest income increased by £1,331 million, 9% to
£15,651 million reflecting strong performances in Corporate
Markets and Citizens, and good growth in banking fee income,
financial markets income and insurance premium income. The
effect of implementing the requirements of IAS 39 and IFRS 4
in 2004 would have been to reduce non-interest income by
£808 million for the year ended 31 December 2004.
2005 compared with pro forma 2004
Non-interest income increased by £2,139 million, 16% to
£15,651 million and represents 61% of total income (2004 –
60%). Excluding general insurance premium income, non-
interest income rose by 24% or £1,883 million to £9,872 million
reflecting strong performances in Corporate Markets, up 23%
or £1,097 million and Citizens, up 73% or £483 million.
Within non-interest income, fees and commissions receivable
increased by 11% or £679 million, to £6,750 million, while
fees and commissions payable decreased by £79 million to
£1,841 million.
Income from trading activities, which primarily arises from
providing customers with debt and risk management products
in interest rate, currency and credit, was up £387 million, 20%.
The increase on 2004 reflected increased customer volumes.
Other operating income increased by 39%, £738 million to
£2,620 million. This was principally due to higher income from
rental assets, increased bancassurance income and realised
investment securities gains.
General insurance premium income, after reinsurance, rose by
5%, or £256 million to £5,779 million reflecting volume growth
in motor and home insurance products.
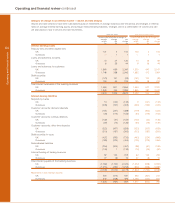
Non-interest income
Pro forma
2005 2004 2004
£m £m £m
Fees and commissions receivable 6,750 6,473 6,071
Fees and commissions payable (1,841) (1,926) (1,920)
Income from trading activities 2,343 1,988 1,956
Other operating income 2,620 2,138 1,882
9,872 8,673 7,989
Insurance premium income 6,076 6,146 6,032
Reinsurers’ share (297) (499) (509)
5,779 5,647 5,523
15,651 14,320 13,512