RBS 2005 Annual Report Download - page 60
Download and view the complete annual report
Please find page 60 of the 2005 RBS annual report below. You can navigate through the pages in the report by either clicking on the pages listed below, or by using the keyword search tool below to find specific information within the annual report.-
 1
1 -
2
-
3
-
4
-
5
-
6
-
7
-
8
-
9
-
10
-
11
-
12
-
13
-
14
-
15
-
16
-
17
-
18
-
19
-
20
-
21
-
22
-
23
-
24
-
25
-
26
-
27
-
28
-
29
-
30
-
31
-
32
-
33
-
34
-
35
-
36
-
37
-
38
-
39
-
40
-
41
-
42
-
43
-
44
-
45
-
46
-
47
-
48
-
49
-
 50
50 -
 51
51 -
 52
52 -
 53
53 -
 54
54 -
 55
55 -
 56
56 -
 57
57 -
 58
58 -
 59
59 -
 60
60 -
 61
61 -
 62
62 -
 63
63 -
 64
64 -
 65
65 -
 66
66 -
 67
67 -
 68
68 -
 69
69 -
 70
70 -
71
-
72
-
73
-
74
-
75
-
76
-
77
-
78
-
79
-
80
-
81
-
82
-
83
-
84
-
85
-
86
-
87
-
88
-
89
-
90
-
91
-
92
-
93
-
94
-
95
-
96
-
97
-
98
-
99
-
100
-
101
-
102
-
103
-
104
-
105
-
106
-
107
-
108
-
109
-
110
-
111
-
112
-
113
-
114
-
115
-
116
-
117
-
118
-
119
-
120
-
121
-
122
-
123
-
124
-
125
-
126
-
127
-
128
-
129
-
130
-
131
-
132
-
133
-
134
-
135
-
136
-
137
-
138
-
139
-
140
-
141
-
142
-
143
-
144
-
145
-
146
-
147
-
148
-
149
-
150
-
151
-
152
-
153
-
154
-
155
-
156
-
157
-
158
-
159
-
160
-
161
-
162
-
163
-
164
-
165
-
166
-
167
-
168
-
169
-
170
-
171
-
172
-
173
-
174
-
175
-
176
-
177
-
178
-
179
-
180
-
181
-
182
-
183
-
184
-
185
-
186
-
187
-
188
-
189
-
190
-
191
-
192
-
193
-
194
-
195
-
196
-
197
-
198
-
199
-
200
-
201
-
202
-
203
-
204
-
205
-
206
-
207
-
208
-
209
-
210
-
211
-
212
-
213
-
214
-
215
-
216
-
217
-
218
-
219
-
220
-
221
-
222
-
223
-
224
-
225
-
226
-
227
-
228
-
229
-
230
-
231
-
232
-
233
-
234
-
235
-
236
-
237
-
238
-
239
-
240
-
241
-
242
-
243
-
244
-
245
-
246
-
247
-
248
-
249
-
250
-
251
-
252
-
253
-
254
-
255
-
256
-
257
-
258
-
259
-
260
-
261
-
262
-
263
-
264
-
265
-
266
-
267
-
268
-
269
-
270
-
271
-
272
 |
 |

58
Operating and financial review
Operating and financial review continued
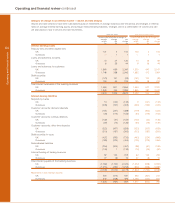
Summary consolidated income statement for the year ended 31 December 2005
The income statement set out below shows purchased intangibles amortisation, integration costs and net gain on sale of strategic
investments and subsidiaries separately. In the statutory consolidated income statement on page 145, these items are included in
non-interest income and operating expenses as appropriate.
Pro forma
2005 2004 2004
£m £m £m
Net interest income 9,918 9,071 9,003
Fees and commissions receivable 6,750 6,473 6,071
Fees and commissions payable (1,841) (1,926) (1,920)
Other non-interest income 4,963 4,126 3,838
Insurance premium income 6,076 6,146 6,032
Reinsurers’ share (297) (499) (509)
Non-interest income 15,651 14,320 13,512
Total income 25,569 23,391 22,515
Operating expenses 11,298 9,797 9,871
Profit before other operating charges 14,271 13,594 12,644
Insurance claims 4,413 4,565 4,245
Reinsurers’ share (100) (305) (299)
Operating profit before impairment losses 9,958 9,334 8,698
Impairment losses 1,707 1,485 1,590
Profit before tax, purchased intangibles amortisation, integration costs and
net gain on sale of strategic investments and subsidiaries 8,251 7,849 7,108
Amortisation of purchased intangible assets 97 45 45
Integration costs 458 520 520
Net gain on sale of strategic investments and subsidiaries 240 ——
Profit before tax 7,936 7,284 6,543
Tax on profit 2,378 1,995 1,856
Profit for the year 5,558 5,289 4,687
Minority interests 57 177 51
Preference dividends 109 256 16
Profit attributable to ordinary shareholders 5,392 4,856 4,620
Basic earnings per ordinary share 169.4p 157.4p 149.8p
Intangibles amortisation 2.0p 1.2p 1.2p
Integration costs 9.9p 11.6p 11.6p
Net gain on sale of strategic investments and subsidiaries (5.4p) ——
Adjusted earnings per ordinary share 175.9p 170.2p 162.6p