RBS 2005 Annual Report Download - page 62
Download and view the complete annual report
Please find page 62 of the 2005 RBS annual report below. You can navigate through the pages in the report by either clicking on the pages listed below, or by using the keyword search tool below to find specific information within the annual report.-
 1
1 -
2
-
3
-
4
-
5
-
6
-
7
-
8
-
9
-
10
-
11
-
12
-
13
-
14
-
15
-
16
-
17
-
18
-
19
-
20
-
21
-
22
-
23
-
24
-
25
-
26
-
27
-
28
-
29
-
30
-
31
-
32
-
33
-
34
-
35
-
36
-
37
-
38
-
39
-
40
-
41
-
42
-
43
-
44
-
45
-
46
-
47
-
48
-
49
-
50
-
51
-
 52
52 -
 53
53 -
 54
54 -
 55
55 -
 56
56 -
 57
57 -
 58
58 -
 59
59 -
 60
60 -
 61
61 -
 62
62 -
 63
63 -
 64
64 -
 65
65 -
 66
66 -
 67
67 -
 68
68 -
 69
69 -
 70
70 -
 71
71 -
 72
72 -
73
-
74
-
75
-
76
-
77
-
78
-
79
-
80
-
81
-
82
-
83
-
84
-
85
-
86
-
87
-
88
-
89
-
90
-
91
-
92
-
93
-
94
-
95
-
96
-
97
-
98
-
99
-
100
-
101
-
102
-
103
-
104
-
105
-
106
-
107
-
108
-
109
-
110
-
111
-
112
-
113
-
114
-
115
-
116
-
117
-
118
-
119
-
120
-
121
-
122
-
123
-
124
-
125
-
126
-
127
-
128
-
129
-
130
-
131
-
132
-
133
-
134
-
135
-
136
-
137
-
138
-
139
-
140
-
141
-
142
-
143
-
144
-
145
-
146
-
147
-
148
-
149
-
150
-
151
-
152
-
153
-
154
-
155
-
156
-
157
-
158
-
159
-
160
-
161
-
162
-
163
-
164
-
165
-
166
-
167
-
168
-
169
-
170
-
171
-
172
-
173
-
174
-
175
-
176
-
177
-
178
-
179
-
180
-
181
-
182
-
183
-
184
-
185
-
186
-
187
-
188
-
189
-
190
-
191
-
192
-
193
-
194
-
195
-
196
-
197
-
198
-
199
-
200
-
201
-
202
-
203
-
204
-
205
-
206
-
207
-
208
-
209
-
210
-
211
-
212
-
213
-
214
-
215
-
216
-
217
-
218
-
219
-
220
-
221
-
222
-
223
-
224
-
225
-
226
-
227
-
228
-
229
-
230
-
231
-
232
-
233
-
234
-
235
-
236
-
237
-
238
-
239
-
240
-
241
-
242
-
243
-
244
-
245
-
246
-
247
-
248
-
249
-
250
-
251
-
252
-
253
-
254
-
255
-
256
-
257
-
258
-
259
-
260
-
261
-
262
-
263
-
264
-
265
-
266
-
267
-
268
-
269
-
270
-
271
-
272
 |
 |

60
Operating and financial review
Operating and financial review continued
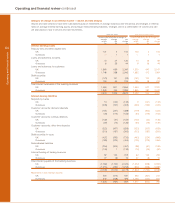
2005 compared with pro forma 2004
Profit
Profit before tax, purchased intangibles amortisation,
integration costs and net gain on sale of strategic investments
and subsidiaries increased by 16% or £1,143 million, from
£7,108 million to £8,251 million.
Profit before tax was up 21%, from £6,543 million to
£7,936 million, reflecting strong organic income growth in
all divisions and a full year’s contribution from acquisitions
made during 2004.
Total income
The Group achieved strong growth in income during 2005.
Total income was up 14% or £3,054 million to £25,569 million.
Excluding acquisitions and at constant exchange rates, total
income was up by 10%, £2,219 million.
Net interest income increased by 10% to £9,918 million and
represents 39% of total income (2004 – 40%). Average loans
and advances to customers and average customer deposits
grew by 23% and 17% respectively, or 17% and 12%
respectively excluding acquisitions.
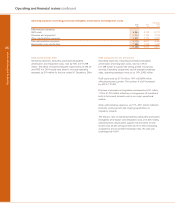
Net interest margin
The Group’s net interest margin at 2.55% was down from
2.81% in 2004, due mainly to growth in corporate and
mortgage lending and a flattening of the US dollar yield curve.
Non-interest income increased by 16% to £15,651 million and
represents 61% of total income (2004 – 60%).
Operating expenses
Operating expenses, excluding intangibles amortisation and
integration costs, rose by 14% to £11,298 million. Excluding
acquisitions and at constant exchange rates, operating
expenses were up by 10%, £962 million.
Cost:income ratio
The Group’s cost:income ratio was 42.4% compared with
42.0% in 2004. Excluding acquisitions and at constant
exchange rates, the cost:income ratio was unchanged at
41.8%.
Net insurance claims
Bancassurance and general insurance claims, after
reinsurance, which under IFRS include maturities and
surrenders, increased by 9% to £4,313 million reflecting
volume growth and maturities of our guaranteed capital bonds.
Impairment losses
Impairment losses were £1,707 million compared with
£1,590 million in 2004, an increase of 7%, or 5% excluding
acquisitions.
Risk elements in lending and potential problem loans represented
1.60% of gross loans and advances to customers excluding
reverse repos at 31 December 2005 (1 January 2005 – 1.84%).
Provision coverage of risk elements in lending and potential
problem loans was 65% compared with 70% at 1 January
2005. This reflects amounts written-off and the changing mix
from unsecured to secured exposures.
Integration
Integration costs were £458 million compared with £520 million
in 2004. Included are software costs relating to the integration
of NatWest which were written-off as incurred under UK GAAP
but on transition to IFRS were capitalised and amortised. All
such software is now fully amortised. The balance principally
relates to the integration of Churchill, First Active and Citizens’
acquisitions, including Charter One which was acquired in
August 2004.
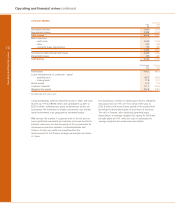
Earnings and dividends
Basic earnings per ordinary share increased by 13%, from
149.8p to 169.4p. Earnings per ordinary share adjusted for
intangibles amortisation, integration costs and net gain on sale
of strategic investments and subsidiaries increased by 8%,
from 162.6p to 175.9p.
Balance sheet
Total assets were £776.8 billion at 31 December 2005, 12%
higher than total assets of £696.5 billion at 1 January 2005.
Lending to customers, excluding repurchase agreements and
stock borrowing (“reverse repos”), increased in 2005 by 16%
or £51.8 billion to £368.3 billion. Customer deposits, excluding
repurchase agreements and stock lending (“repos”), grew by
13% or £33.5 billion to £294.1 billion over the same period.
Capital ratios at 31 December 2005 were 7.6% (Tier 1) and
11.7% (Total).
Profitability
The adjusted after-tax return on ordinary equity, which is based
on profit attributable to ordinary shareholders before
intangibles amortisation, integration costs and net gain on sale
of strategic investments and subsidiaries, and average
ordinary equity, was 18.2%.