RBS 2005 Annual Report Download - page 61
Download and view the complete annual report
Please find page 61 of the 2005 RBS annual report below. You can navigate through the pages in the report by either clicking on the pages listed below, or by using the keyword search tool below to find specific information within the annual report.-
 1
1 -
2
-
3
-
4
-
5
-
6
-
7
-
8
-
9
-
10
-
11
-
12
-
13
-
14
-
15
-
16
-
17
-
18
-
19
-
20
-
21
-
22
-
23
-
24
-
25
-
26
-
27
-
28
-
29
-
30
-
31
-
32
-
33
-
34
-
35
-
36
-
37
-
38
-
39
-
40
-
41
-
42
-
43
-
44
-
45
-
46
-
47
-
48
-
49
-
50
-
 51
51 -
 52
52 -
 53
53 -
 54
54 -
 55
55 -
 56
56 -
 57
57 -
 58
58 -
 59
59 -
 60
60 -
 61
61 -
 62
62 -
 63
63 -
 64
64 -
 65
65 -
 66
66 -
 67
67 -
 68
68 -
 69
69 -
 70
70 -
 71
71 -
72
-
73
-
74
-
75
-
76
-
77
-
78
-
79
-
80
-
81
-
82
-
83
-
84
-
85
-
86
-
87
-
88
-
89
-
90
-
91
-
92
-
93
-
94
-
95
-
96
-
97
-
98
-
99
-
100
-
101
-
102
-
103
-
104
-
105
-
106
-
107
-
108
-
109
-
110
-
111
-
112
-
113
-
114
-
115
-
116
-
117
-
118
-
119
-
120
-
121
-
122
-
123
-
124
-
125
-
126
-
127
-
128
-
129
-
130
-
131
-
132
-
133
-
134
-
135
-
136
-
137
-
138
-
139
-
140
-
141
-
142
-
143
-
144
-
145
-
146
-
147
-
148
-
149
-
150
-
151
-
152
-
153
-
154
-
155
-
156
-
157
-
158
-
159
-
160
-
161
-
162
-
163
-
164
-
165
-
166
-
167
-
168
-
169
-
170
-
171
-
172
-
173
-
174
-
175
-
176
-
177
-
178
-
179
-
180
-
181
-
182
-
183
-
184
-
185
-
186
-
187
-
188
-
189
-
190
-
191
-
192
-
193
-
194
-
195
-
196
-
197
-
198
-
199
-
200
-
201
-
202
-
203
-
204
-
205
-
206
-
207
-
208
-
209
-
210
-
211
-
212
-
213
-
214
-
215
-
216
-
217
-
218
-
219
-
220
-
221
-
222
-
223
-
224
-
225
-
226
-
227
-
228
-
229
-
230
-
231
-
232
-
233
-
234
-
235
-
236
-
237
-
238
-
239
-
240
-
241
-
242
-
243
-
244
-
245
-
246
-
247
-
248
-
249
-
250
-
251
-
252
-
253
-
254
-
255
-
256
-
257
-
258
-
259
-
260
-
261
-
262
-
263
-
264
-
265
-
266
-
267
-
268
-
269
-
270
-
271
-
272
 |
 |

section
01
Operating and
financial review
59
Operating and financial review
Annual Report and Accounts 2005
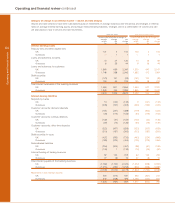
2005 compared with 2004
Profit
The implementation of IAS 32, IAS 39 and IFRS 4 affected the
timing of recognition of income and costs, classification of
debt and equity, impairment provisions and accounting for
insurance contracts in 2005. The effect of implementing the
requirements of these standards in 2004 would have been to
reduce profit before tax by £741 million for the year ended
31 December 2004.
Profit before tax, purchased intangibles amortisation, integration
costs and net gain on sale of strategic investments and
subsidiaries increased by 5% or £402 million, from
£7,849 million to £8,251 million. Profit before tax was up 9%,
from £7,284 million to £7,936 million.
Total income
Total income, excluding the gain on sale of strategic
investment, was up 9% or £2,178 million to £25,569 million.
This reflected growth in all divisions particularly Corporate
Markets, Citizens and Ulster Bank. The effect of implementing
the requirements of IAS 32, IAS 39 and IFRS 4 in 2004 would
have been to reduce total income by £876 million for the year
ended 31 December 2004.
Net interest income increased by 9% to £9,918 million.
Average loans and advances to customers and average
customer deposits grew by 24% and 17% respectively. The
effect of implementing the requirements of IAS 32, IAS 39 and
IFRS 4 in 2004 would have been to reduce net interest income
by £68 million for the year ended 31 December 2004. Interest
income is recognised on a constant yield basis under IFRS;
under UK GAAP interest was recognised on an accrual basis.
Non-interest income increased by 9% to £15,651 million with
good growth in banking fee income, financial markets income
and insurance premium income. Non-interest income
represents 61% of total income. The effect of implementing the
requirements of IAS 39 and IFRS 4 in 2004 would have been to
reduce non-interest income by £808 million for the year ended
31 December 2004.
Operating expenses
Operating expenses, excluding intangibles amortisation, integration
costs and loss on sale of subsidiaries, rose by 15% to £11,298
million. The effect of implementing the requirements of IAS 39
and IFRS 4 in 2004 would have been to increase operating
expenses by £74 million for the year ended 31 December 2004.
Integration
Integration costs were £458 million compared with £520 million
in 2004. Included in both periods are software amortisation
under IFRS relating to the acquisition of NatWest. The balance
principally relates to the integration of Churchill, First Active
and Citizens’ acquisitions, including Charter One which was
acquired in August 2004.
Cost:income ratio
The Group’s cost:income ratio in 2005 excluding acquisitions
was 41.8%, reflecting the impact on income in 2005 of IAS 32,
IAS 39 and IFRS 4.
Net insurance claims
Bancassurance and general insurance claims, after
reinsurance which under IFRS, include maturities and
surrenders, increased by 1% to £4,313 million. The increase
reflects volume growth and maturities of our guaranteed
capital bonds. The effect of implementing the requirements
of IFRS 4 in 2004 would have been to reduce net claims by
£314 million for the year ended 31 December 2004.
Impairment losses
Impairment losses were £1,707 million compared with
£1,485 million in 2004. Overall credit quality remained strong
in 2005, with improvements in Corporate Markets partly
offsetting higher impairment losses in Retail Markets. The
effect of implementing the requirements of IAS 39 in 2004
would have been to increase loan impairment losses by
£105 million for the year ended 31 December 2004.
Earnings
Basic earnings per ordinary share increased by 8% from 157.4p
to 169.4p. Earnings per ordinary share, adjusted for purchased
intangibles amortisation, integration costs and net gain on sale
of strategic investments and subsidiaries, increased by 3%,
from 170.2p to 175.9p. The effect of implementing the
requirements of IAS 32, IAS 39 and IFRS 4 in 2004 reduced
both basic and adjusted earnings per share by 7.6p, 5%.
A final dividend of 53.1p per ordinary share, up 29% is
recommended, giving a total dividend for the year of 72.5p, an
increase of 25%. If approved, the final dividend will be paid on
9 June 2006 to shareholders registered on 10 March 2006. The
total dividend is covered 2.4 times by earnings before
purchased intangibles amortisation, integration costs and net
gain on sale of strategic investments and subsidiaries.
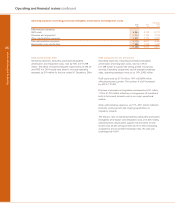
Balance sheet
Total assets of £776.8 billion at 31 December 2005 were up
£188.7 billion, 32%, compared with 31 December 2004, with
£108.4 billion of this increase arising from the implementation
of IAS 32, IAS 39 and IFRS 4 on 1 January 2005, and the
balance reflecting business growth.
Loans and advances to customers were up £70.0 billion,
20%, at £417.2 billion of which £33.9 billion resulted from the
implementation of IAS 32 and IAS 39, mainly as a result of the
grossing up of previously netted customer balances. Excluding
this and a decrease in reverse repos, down 24%, £15.7 billion
to £48.9 billion, customer lending was up £51.8 billion, 16%,
reflecting organic growth across all divisions.
Customer accounts were up £59.5 billion, 21% at £342.9 billion
with £31.7 billion arising from the implementation of IAS 32 and
IAS 39, largely reflecting the grossing up of previously
netted deposits. Excluding this and repos, which decreased
£5.7 billion, 11% to £48.8 billion, deposits rose by £33.5 billion,
13%, to £294.1 billion with good growth in all divisions.
Capital ratios at 31 December 2005 were 7.6% (Tier 1) and
11.7% (Total).