RBS 2005 Annual Report Download - page 245
Download and view the complete annual report
Please find page 245 of the 2005 RBS annual report below. You can navigate through the pages in the report by either clicking on the pages listed below, or by using the keyword search tool below to find specific information within the annual report.-
 1
1 -
2
-
3
-
4
-
5
-
6
-
7
-
8
-
9
-
10
-
11
-
12
-
13
-
14
-
15
-
16
-
17
-
18
-
19
-
20
-
21
-
22
-
23
-
24
-
25
-
26
-
27
-
28
-
29
-
30
-
31
-
32
-
33
-
34
-
35
-
36
-
37
-
38
-
39
-
40
-
41
-
42
-
43
-
44
-
45
-
46
-
47
-
48
-
49
-
50
-
51
-
52
-
53
-
54
-
55
-
56
-
57
-
58
-
59
-
60
-
61
-
62
-
63
-
64
-
65
-
66
-
67
-
68
-
69
-
70
-
71
-
72
-
73
-
74
-
75
-
76
-
77
-
78
-
79
-
80
-
81
-
82
-
83
-
84
-
85
-
86
-
87
-
88
-
89
-
90
-
91
-
92
-
93
-
94
-
95
-
96
-
97
-
98
-
99
-
100
-
101
-
102
-
103
-
104
-
105
-
106
-
107
-
108
-
109
-
110
-
111
-
112
-
113
-
114
-
115
-
116
-
117
-
118
-
119
-
120
-
121
-
122
-
123
-
124
-
125
-
126
-
127
-
128
-
129
-
130
-
131
-
132
-
133
-
134
-
135
-
136
-
137
-
138
-
139
-
140
-
141
-
142
-
143
-
144
-
145
-
146
-
147
-
148
-
149
-
150
-
151
-
152
-
153
-
154
-
155
-
156
-
157
-
158
-
159
-
160
-
161
-
162
-
163
-
164
-
165
-
166
-
167
-
168
-
169
-
170
-
171
-
172
-
173
-
174
-
175
-
176
-
177
-
178
-
179
-
180
-
181
-
182
-
183
-
184
-
185
-
186
-
187
-
188
-
189
-
190
-
191
-
192
-
193
-
194
-
195
-
196
-
197
-
198
-
199
-
200
-
201
-
202
-
203
-
204
-
205
-
206
-
207
-
208
-
209
-
210
-
211
-
212
-
213
-
214
-
215
-
216
-
217
-
218
-
219
-
220
-
221
-
222
-
223
-
224
-
225
-
226
-
227
-
228
-
229
-
230
-
231
-
232
-
233
-
234
-
 235
235 -
 236
236 -
 237
237 -
 238
238 -
 239
239 -
 240
240 -
 241
241 -
 242
242 -
 243
243 -
 244
244 -
 245
245 -
 246
246 -
 247
247 -
 248
248 -
 249
249 -
 250
250 -
 251
251 -
 252
252 -
 253
253 -
 254
254 -
 255
255 -
256
-
257
-
258
-
259
-
260
-
261
-
262
-
263
-
264
-
265
-
266
-
267
-
268
-
269
-
270
-
271
-
272
 |
 |

section
04
Additional
information
243
Additional information
Annual Report and Accounts 2005
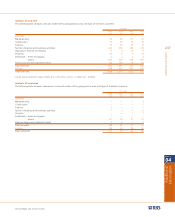
Other financial data based upon UK GAAP 2004 2003 2002 2001
Earnings per ordinary share – pence 138.0 76.9 70.6 67.6
Diluted earnings per ordinary share – pence (1) 136.9 76.3 69.6 66.3
Adjusted earnings per ordinary share – pence 172.5 157.2 146.3 127.9
Dividends per ordinary share – pence 58.0 50.3 43.7 38.0
Dividend payout ratio 43.2% 66.1% 62.3% 58.1%
Share price per ordinary share at period end – £ 17.52 16.46 14.88 16.72
Market capitalisation at period end – £bn 55.6 48.8 43.2 47.8
Net asset value per ordinary share – £ 8.62 7.82 7.43 7.79
Return on average total assets (2) 0.82% 0.51% 0.52% 0.53%
Return on average equity shareholders’ funds (3) 16.0% 9.8% 8.8% 8.9%
Adjusted return on average equity shareholders’ funds (4) 20.1% 20.1% 18.3% 16.8%
Average shareholders’ equity as a percentage
of average total assets 5.7% 5.9% 6.8% 7.2%
Risk asset ratio – Tier 1 7.0% 7.4% 7.3% 7.1%
Risk asset ratio – Total 11.7% 11.8% 11.7% 11.5%
Ratio of earnings to combined fixed charges and preference
share dividends (5)
– including interest on deposits 1.84 1.95 1.74 1.49
– excluding interest on deposits 7.09 7.08 5.20 4.45
Ratio of earnings to fixed charges only (5)
– including interest on deposits 1.90 2.04 1.83 1.55
– excluding interest on deposits 9.26 9.73 7.24 6.52
Notes:
(1) Convertible preference shares have not been included in the computation of diluted earnings per share as their effect was anti-dilutive.
(2) Return on average total assets represents profit attributable to ordinary shareholders as a percentage of average total assets.
(3) Return on average equity shareholders’ funds represents profit attributable to ordinary shareholders expressed as a percentage of average equity shareholders’ funds.
(4) Adjusted return on average equity shareholders’ funds represents profit attributable to ordinary shareholders before integration costs, goodwill amortisation and the AVS
dividend, in 2003, 2002 and 2001 expressed as a percentage of average equity shareholders’ funds.
(5) For this purpose, earnings consist of income before tax and minority interests, plus fixed charges less the unremitted income of associated undertakings (share of profits less
dividends received). Fixed charges consist of total interest expense, including or excluding interest on deposits and debt securities in issue, as appropriate, and the proportion
of rental expense deemed representative of the interest factor (one third of total rental expenses).