RBS 2005 Annual Report Download - page 153
Download and view the complete annual report
Please find page 153 of the 2005 RBS annual report below. You can navigate through the pages in the report by either clicking on the pages listed below, or by using the keyword search tool below to find specific information within the annual report.-
 1
1 -
2
-
3
-
4
-
5
-
6
-
7
-
8
-
9
-
10
-
11
-
12
-
13
-
14
-
15
-
16
-
17
-
18
-
19
-
20
-
21
-
22
-
23
-
24
-
25
-
26
-
27
-
28
-
29
-
30
-
31
-
32
-
33
-
34
-
35
-
36
-
37
-
38
-
39
-
40
-
41
-
42
-
43
-
44
-
45
-
46
-
47
-
48
-
49
-
50
-
51
-
52
-
53
-
54
-
55
-
56
-
57
-
58
-
59
-
60
-
61
-
62
-
63
-
64
-
65
-
66
-
67
-
68
-
69
-
70
-
71
-
72
-
73
-
74
-
75
-
76
-
77
-
78
-
79
-
80
-
81
-
82
-
83
-
84
-
85
-
86
-
87
-
88
-
89
-
90
-
91
-
92
-
93
-
94
-
95
-
96
-
97
-
98
-
99
-
100
-
101
-
102
-
103
-
104
-
105
-
106
-
107
-
108
-
109
-
110
-
111
-
112
-
113
-
114
-
115
-
116
-
117
-
118
-
119
-
120
-
121
-
122
-
123
-
124
-
125
-
126
-
127
-
128
-
129
-
130
-
131
-
132
-
133
-
134
-
135
-
136
-
137
-
138
-
139
-
140
-
141
-
142
-
 143
143 -
 144
144 -
 145
145 -
 146
146 -
 147
147 -
 148
148 -
 149
149 -
 150
150 -
 151
151 -
 152
152 -
 153
153 -
 154
154 -
 155
155 -
 156
156 -
 157
157 -
 158
158 -
 159
159 -
 160
160 -
 161
161 -
 162
162 -
 163
163 -
164
-
165
-
166
-
167
-
168
-
169
-
170
-
171
-
172
-
173
-
174
-
175
-
176
-
177
-
178
-
179
-
180
-
181
-
182
-
183
-
184
-
185
-
186
-
187
-
188
-
189
-
190
-
191
-
192
-
193
-
194
-
195
-
196
-
197
-
198
-
199
-
200
-
201
-
202
-
203
-
204
-
205
-
206
-
207
-
208
-
209
-
210
-
211
-
212
-
213
-
214
-
215
-
216
-
217
-
218
-
219
-
220
-
221
-
222
-
223
-
224
-
225
-
226
-
227
-
228
-
229
-
230
-
231
-
232
-
233
-
234
-
235
-
236
-
237
-
238
-
239
-
240
-
241
-
242
-
243
-
244
-
245
-
246
-
247
-
248
-
249
-
250
-
251
-
252
-
253
-
254
-
255
-
256
-
257
-
258
-
259
-
260
-
261
-
262
-
263
-
264
-
265
-
266
-
267
-
268
-
269
-
270
-
271
-
272
 |
 |
section
03
Financial
statements
151
Notes on the accounts
Annual Report and Accounts 2005
Main Scheme All Schemes
Present Present
value of value of
Fair value defined Net Fair value defined Net
of plan benefit pension of plan benefit pension
assets obligations liability assets obligations liability
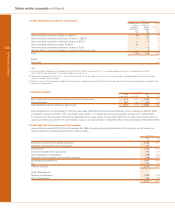
Changes in value of net pension liability £m £m £m £m £m £m
At 1 January 2004 11,797 13,594 1,797 12,862 14,898 2,036
Currency translation and other adjustments — — — (18) (9) 9
Income statement:
Expected return 838 (838) 920 (920)
Interest cost 759 759 837 837
Current service cost 400 400 469 469
Past service cost —— 1111
838 1,159 321 920 1,317 397
Statement of recognised income and expense:
Actuarial gains and losses 392 1,825 1,433 408 2,009 1,601
Acquisitions of subsidiaries — — — 45 88 43
Contributions by employer 1,069 (1,069) 1,146 (1,146)
Contributions by plan participants —— 3 3
Benefits paid (494) (494) (534) (534)
Expenses included in service cost (33) (33) (34) (34)
At 31 December 2004 13,569 16,051 2,482 14,798 17,738 2,940
Currency translation and other adjustments — — — 26 26 —
Income statement:
Expected return 930 (930) 1,017 (1,017)
Interest cost 865 865 953 953
Current service cost 447 447 522 522
Past service cost 3 3 4 4
930 1,315 385 1,017 1,479 462
Statement of recognised income and expense:
Actuarial gains and losses 1,556 2,273 717 1,660 2,459 799
Disposal of subsidiaries ————(14) (14)
Contributions by employer 380 (380) 452 (452)
Contributions by plan participants — — 4 4
Benefits paid (504) (504) (550) (550)
Expenses included in service cost (17) (17) (19) (19)
At 31 December 2005 15,914 19,118 3,204 17,388 21,123 3,735
The Group expects to contribute £444 million to its defined benefit pension schemes in 2006 (Main Scheme – £384 million).
Of the net pension liability, £104 million (2004 – £95 million) relates to unfunded schemes.