RBS 2005 Annual Report Download - page 75
Download and view the complete annual report
Please find page 75 of the 2005 RBS annual report below. You can navigate through the pages in the report by either clicking on the pages listed below, or by using the keyword search tool below to find specific information within the annual report.-
 1
1 -
2
-
3
-
4
-
5
-
6
-
7
-
8
-
9
-
10
-
11
-
12
-
13
-
14
-
15
-
16
-
17
-
18
-
19
-
20
-
21
-
22
-
23
-
24
-
25
-
26
-
27
-
28
-
29
-
30
-
31
-
32
-
33
-
34
-
35
-
36
-
37
-
38
-
39
-
40
-
41
-
42
-
43
-
44
-
45
-
46
-
47
-
48
-
49
-
50
-
51
-
52
-
53
-
54
-
55
-
56
-
57
-
58
-
59
-
60
-
61
-
62
-
63
-
64
-
 65
65 -
 66
66 -
 67
67 -
 68
68 -
 69
69 -
 70
70 -
 71
71 -
 72
72 -
 73
73 -
 74
74 -
 75
75 -
 76
76 -
 77
77 -
 78
78 -
 79
79 -
 80
80 -
 81
81 -
 82
82 -
 83
83 -
 84
84 -
 85
85 -
86
-
87
-
88
-
89
-
90
-
91
-
92
-
93
-
94
-
95
-
96
-
97
-
98
-
99
-
100
-
101
-
102
-
103
-
104
-
105
-
106
-
107
-
108
-
109
-
110
-
111
-
112
-
113
-
114
-
115
-
116
-
117
-
118
-
119
-
120
-
121
-
122
-
123
-
124
-
125
-
126
-
127
-
128
-
129
-
130
-
131
-
132
-
133
-
134
-
135
-
136
-
137
-
138
-
139
-
140
-
141
-
142
-
143
-
144
-
145
-
146
-
147
-
148
-
149
-
150
-
151
-
152
-
153
-
154
-
155
-
156
-
157
-
158
-
159
-
160
-
161
-
162
-
163
-
164
-
165
-
166
-
167
-
168
-
169
-
170
-
171
-
172
-
173
-
174
-
175
-
176
-
177
-
178
-
179
-
180
-
181
-
182
-
183
-
184
-
185
-
186
-
187
-
188
-
189
-
190
-
191
-
192
-
193
-
194
-
195
-
196
-
197
-
198
-
199
-
200
-
201
-
202
-
203
-
204
-
205
-
206
-
207
-
208
-
209
-
210
-
211
-
212
-
213
-
214
-
215
-
216
-
217
-
218
-
219
-
220
-
221
-
222
-
223
-
224
-
225
-
226
-
227
-
228
-
229
-
230
-
231
-
232
-
233
-
234
-
235
-
236
-
237
-
238
-
239
-
240
-
241
-
242
-
243
-
244
-
245
-
246
-
247
-
248
-
249
-
250
-
251
-
252
-
253
-
254
-
255
-
256
-
257
-
258
-
259
-
260
-
261
-
262
-
263
-
264
-
265
-
266
-
267
-
268
-
269
-
270
-
271
-
272
 |
 |

section
01
Operating and
financial review
73
Operating and financial review
Annual Report and Accounts 2005
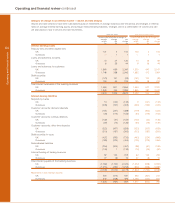
Retail Markets
Retail Markets was established in June 2005 to strengthen co-ordination and delivery of our multi-brand retail strategy across our
product range, and comprises Retail Banking, Retail Direct and Wealth Management. The performance of each of these divisions is
discussed on pages 74 to 76.
Pro forma
2005 2004
£m £m
Net interest income 4,499 4,362
Non-interest income 3,714 3,322
Total income 8,213 7,684
Direct expenses
– staff costs 1,514 1,450
– other 821 856
2,335 2,306
Insurance net claims 486 398
Contribution before impairment losses 5,392 4,980
Impairment losses 1,185 916
Contribution 4,207 4,064
1 January
2005 2005
£bn £bn
Total banking assets 114.4 104.9
Loans and advances to customers
– mortgages 64.6 56.9
– personal 21.5 20.2
– cards 9.6 9.4
– business 16.7 15.9
Customer deposits 105.9 97.0
Investment management assets – excluding deposits 31.4 26.6
Weighted risk assets 80.6 76.5
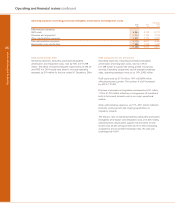
Total income increased by 7% to £8,213 million and
contribution by 4% to £4,207 million, with good discipline on
costs helping to offset increased impairment losses on
unsecured lending.
At the end of 2004 we referred to the changes being seen in
the retail markets with the consumer transitioning from an
environment which had seen several years of very fast growth
in consumer lending to an increased emphasis on savings and
investment.
As a consequence, we planned to refocus our strategy to grow
our sales of deposit and bancassurance products faster than
the market, to exploit our potential for building profitable market
share in the mortgage market and to concentrate more on the
development of our branch franchise, building on our strong
service proposition. During 2005 this transition has gathered
momentum and we have achieved good progress in our
strategies.
Branch deposit balances outgrew the market and our
bancassurance sales accelerated strongly, with annual
premium equivalent sales 25% higher than in 2004. Our share
of net mortgage lending, assisted by the launch of the First
Active brand, reached 8% in 2005. Our credit card business,
meanwhile, made excellent headway in marketing through
branch channels; we gained 60% more credit card customers
in our core NatWest and RBS brands in the second half than in
the same period of 2004.