RBS 2005 Annual Report Download - page 236
Download and view the complete annual report
Please find page 236 of the 2005 RBS annual report below. You can navigate through the pages in the report by either clicking on the pages listed below, or by using the keyword search tool below to find specific information within the annual report.-
 1
1 -
2
-
3
-
4
-
5
-
6
-
7
-
8
-
9
-
10
-
11
-
12
-
13
-
14
-
15
-
16
-
17
-
18
-
19
-
20
-
21
-
22
-
23
-
24
-
25
-
26
-
27
-
28
-
29
-
30
-
31
-
32
-
33
-
34
-
35
-
36
-
37
-
38
-
39
-
40
-
41
-
42
-
43
-
44
-
45
-
46
-
47
-
48
-
49
-
50
-
51
-
52
-
53
-
54
-
55
-
56
-
57
-
58
-
59
-
60
-
61
-
62
-
63
-
64
-
65
-
66
-
67
-
68
-
69
-
70
-
71
-
72
-
73
-
74
-
75
-
76
-
77
-
78
-
79
-
80
-
81
-
82
-
83
-
84
-
85
-
86
-
87
-
88
-
89
-
90
-
91
-
92
-
93
-
94
-
95
-
96
-
97
-
98
-
99
-
100
-
101
-
102
-
103
-
104
-
105
-
106
-
107
-
108
-
109
-
110
-
111
-
112
-
113
-
114
-
115
-
116
-
117
-
118
-
119
-
120
-
121
-
122
-
123
-
124
-
125
-
126
-
127
-
128
-
129
-
130
-
131
-
132
-
133
-
134
-
135
-
136
-
137
-
138
-
139
-
140
-
141
-
142
-
143
-
144
-
145
-
146
-
147
-
148
-
149
-
150
-
151
-
152
-
153
-
154
-
155
-
156
-
157
-
158
-
159
-
160
-
161
-
162
-
163
-
164
-
165
-
166
-
167
-
168
-
169
-
170
-
171
-
172
-
173
-
174
-
175
-
176
-
177
-
178
-
179
-
180
-
181
-
182
-
183
-
184
-
185
-
186
-
187
-
188
-
189
-
190
-
191
-
192
-
193
-
194
-
195
-
196
-
197
-
198
-
199
-
200
-
201
-
202
-
203
-
204
-
205
-
206
-
207
-
208
-
209
-
210
-
211
-
212
-
213
-
214
-
215
-
216
-
217
-
218
-
219
-
220
-
221
-
222
-
223
-
224
-
225
-
 226
226 -
 227
227 -
 228
228 -
 229
229 -
 230
230 -
 231
231 -
 232
232 -
 233
233 -
 234
234 -
 235
235 -
 236
236 -
 237
237 -
 238
238 -
 239
239 -
 240
240 -
 241
241 -
 242
242 -
 243
243 -
 244
244 -
 245
245 -
 246
246 -
247
-
248
-
249
-
250
-
251
-
252
-
253
-
254
-
255
-
256
-
257
-
258
-
259
-
260
-
261
-
262
-
263
-
264
-
265
-
266
-
267
-
268
-
269
-
270
-
271
-
272
 |
 |

234
Additional information
Additional information continued
Amounts in accordance with IFRS
Analysis of loans and advances to customers – IFRS
The following table analyses loans and advances to customers before provisions by remaining maturity, geographical area and
type of customer. Overdrafts are included in the ‘Within 1 year’ category.
After 1
Within but within After 2005
1 year 5 years 5 years Total 2004
£m £m £m £m £m
UK
Central and local government 3,336 — 4 3,340 1,866
Manufacturing 10,552 555 508 11,615 6,292
Construction 5,790 726 758 7,274 5,024
Finance 25,424 1,229 438 27,091 24,638
Service industries and business activities 31,448 3,817 5,422 40,687 30,867
Agriculture, forestry and fishing 1,644 399 602 2,645 2,481
Property 24,401 3,264 5,234 32,899 26,448
Individuals – home mortgages 19,576 4,284 41,426 65,286 57,535
Individuals – other 15,935 6,806 3,582 26,323 26,459
Finance leases and instalment credit 3,420 3,941 6,548 13,909 13,044
Accrued interest 1,247 1 2 1,250
Total domestic 142,773 25,022 64,524 232,319 194,654
Overseas residents 39,446 6,167 6,621 52,234 48,183
Total UK offices 182,219 31,189 71,145 284,553 242,837
Overseas
US 27,147 27,541 35,918 90,606 74,027
Rest of the World 23,691 7,417 14,843 45,951 34,555
Total Overseas offices 50,838 34,958 50,761 136,557 108,582
Loans and advances to customers – gross 233,057 66,147 121,906 421,110 351,419
Loan impairment provisions (3,884) (4,168)
Loans and advances to customers – net 417,226 347,251
Fixed rate 30,966 29,099 40,683 100,748 101,227
Variable rate 202,091 37,048 81,223 320,362 250,192
Loans and advances to customers – gross 233,057 66,147 121,906 421,110 351,419
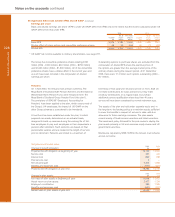
Cross border exposures
Cross border exposures are defined as loans to banks and customers (including finance lease and instalment credit receivables)
and other monetary assets, including non-local currency claims of overseas offices on local residents.
The Group monitors the geographical breakdown of these exposures based on the country of domicile of the borrower or guarantor
of ultimate risk.
The table below sets out the Group’s cross border outstandings in excess of 0.75% of Group total assets (including acceptances),
which totalled £776.8 billion (2004 – £588.5 billion). None of these countries has experienced repayment difficulties that have
required refinancing of outstanding debt.
2005 2004
£m £m
United States 34,246 28,795
Germany 18,395 14,050
France 13,402 9,604
Cayman Islands 11,813 7,258
Netherlands 8,026 8,871
Spain 7,392 5,249
Switzerland 7,061 *
Republic of Ireland 6,008 *
* Less than 0.75% of Group total assets.