RBS 2005 Annual Report Download - page 63
Download and view the complete annual report
Please find page 63 of the 2005 RBS annual report below. You can navigate through the pages in the report by either clicking on the pages listed below, or by using the keyword search tool below to find specific information within the annual report.-
 1
1 -
2
-
3
-
4
-
5
-
6
-
7
-
8
-
9
-
10
-
11
-
12
-
13
-
14
-
15
-
16
-
17
-
18
-
19
-
20
-
21
-
22
-
23
-
24
-
25
-
26
-
27
-
28
-
29
-
30
-
31
-
32
-
33
-
34
-
35
-
36
-
37
-
38
-
39
-
40
-
41
-
42
-
43
-
44
-
45
-
46
-
47
-
48
-
49
-
50
-
51
-
52
-
 53
53 -
 54
54 -
 55
55 -
 56
56 -
 57
57 -
 58
58 -
 59
59 -
 60
60 -
 61
61 -
 62
62 -
 63
63 -
 64
64 -
 65
65 -
 66
66 -
 67
67 -
 68
68 -
 69
69 -
 70
70 -
 71
71 -
 72
72 -
 73
73 -
74
-
75
-
76
-
77
-
78
-
79
-
80
-
81
-
82
-
83
-
84
-
85
-
86
-
87
-
88
-
89
-
90
-
91
-
92
-
93
-
94
-
95
-
96
-
97
-
98
-
99
-
100
-
101
-
102
-
103
-
104
-
105
-
106
-
107
-
108
-
109
-
110
-
111
-
112
-
113
-
114
-
115
-
116
-
117
-
118
-
119
-
120
-
121
-
122
-
123
-
124
-
125
-
126
-
127
-
128
-
129
-
130
-
131
-
132
-
133
-
134
-
135
-
136
-
137
-
138
-
139
-
140
-
141
-
142
-
143
-
144
-
145
-
146
-
147
-
148
-
149
-
150
-
151
-
152
-
153
-
154
-
155
-
156
-
157
-
158
-
159
-
160
-
161
-
162
-
163
-
164
-
165
-
166
-
167
-
168
-
169
-
170
-
171
-
172
-
173
-
174
-
175
-
176
-
177
-
178
-
179
-
180
-
181
-
182
-
183
-
184
-
185
-
186
-
187
-
188
-
189
-
190
-
191
-
192
-
193
-
194
-
195
-
196
-
197
-
198
-
199
-
200
-
201
-
202
-
203
-
204
-
205
-
206
-
207
-
208
-
209
-
210
-
211
-
212
-
213
-
214
-
215
-
216
-
217
-
218
-
219
-
220
-
221
-
222
-
223
-
224
-
225
-
226
-
227
-
228
-
229
-
230
-
231
-
232
-
233
-
234
-
235
-
236
-
237
-
238
-
239
-
240
-
241
-
242
-
243
-
244
-
245
-
246
-
247
-
248
-
249
-
250
-
251
-
252
-
253
-
254
-
255
-
256
-
257
-
258
-
259
-
260
-
261
-
262
-
263
-
264
-
265
-
266
-
267
-
268
-
269
-
270
-
271
-
272
 |
 |

section
01
Operating and
financial review
61
Operating and financial review
Annual Report and Accounts 2005
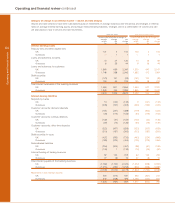
Analysis of results
Net interest income
Pro forma
2005 2004 2004
£m £m £m
Interest receivable (1, 2) 21,505 16,666 17,082
Interest payable (1, 2) (11,720) (7,548) (8,082)
Net interest income (1, 2) 9,785 9,118 9,000
%% %
Gross yield on interest-earning assets of the banking business 5.60 5.26 5.34
Cost of interest-bearing liabilities of the banking business (3.35) (2.70) (2.80)
Interest spread of the banking business 2.25 2.56 2.54
Benefit from interest-free funds 0.30 0.32 0.27
Net interest margin of the banking business 2.55 2.88 2.81
Yields, spreads and margins of the banking business % %%
Gross yield (3)
Group 5.60 5.26 5.34
UK 6.07 5.65 5.79
Overseas 4.76 4.38 4.34
Interest spread (4)
Group 2.25 2.56 2.54
UK 2.48 2.64 2.65
Overseas 1.89 2.48 2.40
Net interest margin (5)
Group 2.55 2.88 2.81
UK 2.66 2.90 2.86
Overseas 2.35 2.83 2.71
The Royal Bank of Scotland plc base rate (average) 4.65 4.38 4.38
London inter-bank three month offered rates (average):
Sterling 4.76 4.64 4.64
Eurodollar 3.56 1.62 1.62
Euro 2.18 2.11 2.11
Notes:
(1) Interest-earning assets and interest-bearing liabilities exclude the Retail bancassurance long-term assets and liabilities attributable to policyholders, in view of their distinct
nature. As a result, net interest income has been adjusted by £59 million (2004 – £47 million).
(2) Interest income has been adjusted by £115 million (2004 – £49 million) and interest expense by £307 million (2004 – £99 million) to record interest on financial assets and
liabilities designated as at fair value through profit or loss. Related interest-earning assets and interest-bearing liabilities have also been adjusted.
(3) Gross yield is the interest rate earned on average interest-earning assets of the banking business.
(4) Interest spread is the difference between the gross yield and the interest rate paid on average interest-bearing liabilities of the banking business.
(5) Net interest margin is net interest income of the banking business as a percentage of average interest-earning assets of the banking business.
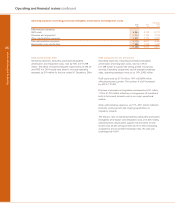
2005 compared with 2004
Group – The net interest margin at 2.55% was down 33 basis
points from 2.88% in 2004. The effect of implementing IAS 32
and IAS 39 in 2004 would have been to decrease the 2004
margin by 7 basis points.
UK – The UK net interest margin, down 24 basis points at
2.66%, would have declined 20 basis points if IAS 32 and
IAS 39 had been implemented in 2004.
Overseas – The Overseas net interest margin was down 48
basis points from 2.83% to 2.35% of which 12 basis points
would have been attributable to the effect of implementing
IAS 32 and IAS 39 in 2004.
2005 compared with pro forma 2004
The net interest margin at 2.55% was down 26 basis points
from 2.81% in 2004. Product mix changes accounted for 17
basis points of the decline, driven by organic growth in lower
margin mortgage lending and large corporate loans, and in
rental assets as well as a change in deposit mix. The flattening
of the US dollar yield curve accounted for 6 basis points of the
reduction:the remainder was due to price re-positioning of
some of our products.
UK – The UK net interest margin declined 20 basis points to
2.66%. This arose primarily from organic growth in lower
margin mortgage lending and large corporate loans, price re-
positioning, changes in deposit mix and higher levels of rental
assets.
Overseas – The Overseas net interest margin declined 36 basis
points from 2.71% to 2.35% mainly reflecting flattening of the US
dollar yield curve and growth in lower margin mortgage lending.