RBS 2005 Annual Report Download - page 205
Download and view the complete annual report
Please find page 205 of the 2005 RBS annual report below. You can navigate through the pages in the report by either clicking on the pages listed below, or by using the keyword search tool below to find specific information within the annual report.-
 1
1 -
2
-
3
-
4
-
5
-
6
-
7
-
8
-
9
-
10
-
11
-
12
-
13
-
14
-
15
-
16
-
17
-
18
-
19
-
20
-
21
-
22
-
23
-
24
-
25
-
26
-
27
-
28
-
29
-
30
-
31
-
32
-
33
-
34
-
35
-
36
-
37
-
38
-
39
-
40
-
41
-
42
-
43
-
44
-
45
-
46
-
47
-
48
-
49
-
50
-
51
-
52
-
53
-
54
-
55
-
56
-
57
-
58
-
59
-
60
-
61
-
62
-
63
-
64
-
65
-
66
-
67
-
68
-
69
-
70
-
71
-
72
-
73
-
74
-
75
-
76
-
77
-
78
-
79
-
80
-
81
-
82
-
83
-
84
-
85
-
86
-
87
-
88
-
89
-
90
-
91
-
92
-
93
-
94
-
95
-
96
-
97
-
98
-
99
-
100
-
101
-
102
-
103
-
104
-
105
-
106
-
107
-
108
-
109
-
110
-
111
-
112
-
113
-
114
-
115
-
116
-
117
-
118
-
119
-
120
-
121
-
122
-
123
-
124
-
125
-
126
-
127
-
128
-
129
-
130
-
131
-
132
-
133
-
134
-
135
-
136
-
137
-
138
-
139
-
140
-
141
-
142
-
143
-
144
-
145
-
146
-
147
-
148
-
149
-
150
-
151
-
152
-
153
-
154
-
155
-
156
-
157
-
158
-
159
-
160
-
161
-
162
-
163
-
164
-
165
-
166
-
167
-
168
-
169
-
170
-
171
-
172
-
173
-
174
-
175
-
176
-
177
-
178
-
179
-
180
-
181
-
182
-
183
-
184
-
185
-
186
-
187
-
188
-
189
-
190
-
191
-
192
-
193
-
194
-
 195
195 -
 196
196 -
 197
197 -
 198
198 -
 199
199 -
 200
200 -
 201
201 -
 202
202 -
 203
203 -
 204
204 -
 205
205 -
 206
206 -
 207
207 -
 208
208 -
 209
209 -
 210
210 -
 211
211 -
 212
212 -
 213
213 -
 214
214 -
 215
215 -
216
-
217
-
218
-
219
-
220
-
221
-
222
-
223
-
224
-
225
-
226
-
227
-
228
-
229
-
230
-
231
-
232
-
233
-
234
-
235
-
236
-
237
-
238
-
239
-
240
-
241
-
242
-
243
-
244
-
245
-
246
-
247
-
248
-
249
-
250
-
251
-
252
-
253
-
254
-
255
-
256
-
257
-
258
-
259
-
260
-
261
-
262
-
263
-
264
-
265
-
266
-
267
-
268
-
269
-
270
-
271
-
272
 |
 |

section
03
Financial
statements
203
Notes on the accounts
Annual Report and Accounts 2005
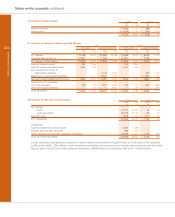
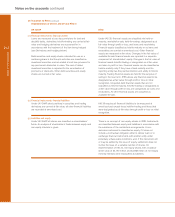
36 Net cash inflow from operating activities Group Company
2005 2004 2005 2004
£m £m £m £m
Operating profit before tax 7,936 7,284 1,932 2,890
Decrease/(increase) in prepayments and accrued income 1,064 (333) 4(17)
Interest on subordinated liabilities 1,271 681 583 318
(Decrease)/increase in accruals and deferred income (1,200) 1,750 8(7)
Provisions for impairment losses 1,707 1,402 ——
Loans and advances written-off net of recoveries (1,870) (1,305) ——
Unwind of discount on impairment losses (144) ———
Profit on sale of property, plant and equipment (91) (69) ——
Loss/(profit) on sale of subsidiaries and associates 80 (4) ——
Profit on sale of securities (667) (167) ——
Charge for defined benefit pensions 462 397 ——
Cash contribution to defined benefit pension schemes (452) (1,146) ——
Other provisions utilised (34) (47) ——
Depreciation and amortisation 1,825 1,674 ——
Other non-cash items 1,493 (1,994) (28) 25
Net cash inflow from trading activities 11,380 8,123 2,499 3,209
(Increase)/decrease in loans and advances to banks and customers (36,778) (72,955) (14) 77
Increase in securities (28,842) (11,883) ——
(Increase)/decrease in other assets (2,390) (2,208) 533
(Increase)/decrease in derivative assets (5,758) (3,753) 50 21
Changes in operating assets (73,768) (90,799) 41 131
Increase in deposits by banks and customers 32,424 53,073 832 18
Increase in insurance liabilities 620 866 ——
Increase/(decrease) in debt securities in issue 24,147 19,073 1,328 (269)
Increase/(decrease) in other liabilities 571 919 (55) (19)
Increase/(decrease) in derivative liabilities 5,161 3,808 (96) (9)
Increase in settlement balances and short positions 10,326 8,796 ——
Changes in operating liabilities 73,249 86,535 2,009 (279)
Total income taxes paid (1,911) (1,366) (18) 36
Net cash inflow from operating activities 8,950 2,493 4,531 3,097
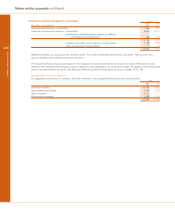
37 Analysis of the net investment in business interests and intangible assets
Group
2005 2004
£m £m
Fair value given for businesses acquired (85) (8,157)
Cash and cash equivalents acquired — 457
Non-cash consideration 10 4
Net outflow of cash in respect of purchases (75) (7,696)
Cash and cash equivalents in businesses sold 10 —
Other assets sold 208 18
Non-cash consideration (30) —
(Loss)/profit on disposal (80) 4
Net inflow of cash in respect of disposals 108 22
Dividends received from joint ventures 16 9
Cash expenditure on intangible assets (345) (303)
Net outflow (296) (7,968)