RBS 2005 Annual Report Download - page 209
Download and view the complete annual report
Please find page 209 of the 2005 RBS annual report below. You can navigate through the pages in the report by either clicking on the pages listed below, or by using the keyword search tool below to find specific information within the annual report.-
 1
1 -
2
-
3
-
4
-
5
-
6
-
7
-
8
-
9
-
10
-
11
-
12
-
13
-
14
-
15
-
16
-
17
-
18
-
19
-
20
-
21
-
22
-
23
-
24
-
25
-
26
-
27
-
28
-
29
-
30
-
31
-
32
-
33
-
34
-
35
-
36
-
37
-
38
-
39
-
40
-
41
-
42
-
43
-
44
-
45
-
46
-
47
-
48
-
49
-
50
-
51
-
52
-
53
-
54
-
55
-
56
-
57
-
58
-
59
-
60
-
61
-
62
-
63
-
64
-
65
-
66
-
67
-
68
-
69
-
70
-
71
-
72
-
73
-
74
-
75
-
76
-
77
-
78
-
79
-
80
-
81
-
82
-
83
-
84
-
85
-
86
-
87
-
88
-
89
-
90
-
91
-
92
-
93
-
94
-
95
-
96
-
97
-
98
-
99
-
100
-
101
-
102
-
103
-
104
-
105
-
106
-
107
-
108
-
109
-
110
-
111
-
112
-
113
-
114
-
115
-
116
-
117
-
118
-
119
-
120
-
121
-
122
-
123
-
124
-
125
-
126
-
127
-
128
-
129
-
130
-
131
-
132
-
133
-
134
-
135
-
136
-
137
-
138
-
139
-
140
-
141
-
142
-
143
-
144
-
145
-
146
-
147
-
148
-
149
-
150
-
151
-
152
-
153
-
154
-
155
-
156
-
157
-
158
-
159
-
160
-
161
-
162
-
163
-
164
-
165
-
166
-
167
-
168
-
169
-
170
-
171
-
172
-
173
-
174
-
175
-
176
-
177
-
178
-
179
-
180
-
181
-
182
-
183
-
184
-
185
-
186
-
187
-
188
-
189
-
190
-
191
-
192
-
193
-
194
-
195
-
196
-
197
-
198
-
 199
199 -
 200
200 -
 201
201 -
 202
202 -
 203
203 -
 204
204 -
 205
205 -
 206
206 -
 207
207 -
 208
208 -
 209
209 -
 210
210 -
 211
211 -
 212
212 -
 213
213 -
 214
214 -
 215
215 -
 216
216 -
 217
217 -
 218
218 -
 219
219 -
220
-
221
-
222
-
223
-
224
-
225
-
226
-
227
-
228
-
229
-
230
-
231
-
232
-
233
-
234
-
235
-
236
-
237
-
238
-
239
-
240
-
241
-
242
-
243
-
244
-
245
-
246
-
247
-
248
-
249
-
250
-
251
-
252
-
253
-
254
-
255
-
256
-
257
-
258
-
259
-
260
-
261
-
262
-
263
-
264
-
265
-
266
-
267
-
268
-
269
-
270
-
271
-
272
 |
 |

section
03
Financial
statements
207
Notes on the accounts
Annual Report and Accounts 2005
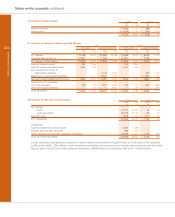
(b) Geographical segments
The geographical analyses in the tables below have been compiled on the basis of location of office where the transactions are
recorded
Group
Rest of
UK USA Europe the world Total
2005 £m £m £m £m £m
Net interest income 6,942 2,225 713 38 9,918
Fees and commissions (net) 3,466 1,100 263 80 4,909
Income from trading activities 1,263 959 56 65 2,343
Other operating income 2,330 211 403 9 2,953
Insurance premium income (net of reinsurers’ share) 5,462 — 317 — 5,779
Total income 19,463 4,495 1,752 192 25,902
Operating profit before tax 5,278 2,032 602 24 7,936
Total assets 492,962 205,514 62,203 16,148 776,827
Total liabilities 473,581 191,189 58,527 15,986 739,283
Net assets attributable to equity shareholders and minority interests 19,381 14,325 3,676 162 37,544
Contingent liabilities and commitments 161,927 51,392 10,714 1,164 225,197
Cost to acquire property, plant and equipment and intangible assets 3,353 337 1,581 17 5,288
2004
Net interest income 6,454 1,825 751 41 9,071
Fees and commissions (net) 3,455 717 301 74 4,547
Income from trading activities 1,113 821 18 36 1,988
Other operating income 1,741 109 284 4 2,138
Insurance premium income (net of reinsurers’ share) 5,390 — 257 — 5,647
Total income 18,153 3,472 1,611 155 23,391
Operating profit before tax 5,059 1,575 583 67 7,284
Total assets 382,623 145,748 45,845 13,906 588,122
Total liabilities 362,297 131,449 43,129 13,850 550,725
Net assets attributable to equity shareholders and minority interests 20,326 14,299 2,716 56 37,397
Contingent liabilities and commitments 151,489 37,972 6,791 618 196,870
Cost to acquire property, plant and equipment and intangible assets 3,811 6,178 1,736 2 11,727