RBS 2005 Annual Report Download - page 241
Download and view the complete annual report
Please find page 241 of the 2005 RBS annual report below. You can navigate through the pages in the report by either clicking on the pages listed below, or by using the keyword search tool below to find specific information within the annual report.-
 1
1 -
2
-
3
-
4
-
5
-
6
-
7
-
8
-
9
-
10
-
11
-
12
-
13
-
14
-
15
-
16
-
17
-
18
-
19
-
20
-
21
-
22
-
23
-
24
-
25
-
26
-
27
-
28
-
29
-
30
-
31
-
32
-
33
-
34
-
35
-
36
-
37
-
38
-
39
-
40
-
41
-
42
-
43
-
44
-
45
-
46
-
47
-
48
-
49
-
50
-
51
-
52
-
53
-
54
-
55
-
56
-
57
-
58
-
59
-
60
-
61
-
62
-
63
-
64
-
65
-
66
-
67
-
68
-
69
-
70
-
71
-
72
-
73
-
74
-
75
-
76
-
77
-
78
-
79
-
80
-
81
-
82
-
83
-
84
-
85
-
86
-
87
-
88
-
89
-
90
-
91
-
92
-
93
-
94
-
95
-
96
-
97
-
98
-
99
-
100
-
101
-
102
-
103
-
104
-
105
-
106
-
107
-
108
-
109
-
110
-
111
-
112
-
113
-
114
-
115
-
116
-
117
-
118
-
119
-
120
-
121
-
122
-
123
-
124
-
125
-
126
-
127
-
128
-
129
-
130
-
131
-
132
-
133
-
134
-
135
-
136
-
137
-
138
-
139
-
140
-
141
-
142
-
143
-
144
-
145
-
146
-
147
-
148
-
149
-
150
-
151
-
152
-
153
-
154
-
155
-
156
-
157
-
158
-
159
-
160
-
161
-
162
-
163
-
164
-
165
-
166
-
167
-
168
-
169
-
170
-
171
-
172
-
173
-
174
-
175
-
176
-
177
-
178
-
179
-
180
-
181
-
182
-
183
-
184
-
185
-
186
-
187
-
188
-
189
-
190
-
191
-
192
-
193
-
194
-
195
-
196
-
197
-
198
-
199
-
200
-
201
-
202
-
203
-
204
-
205
-
206
-
207
-
208
-
209
-
210
-
211
-
212
-
213
-
214
-
215
-
216
-
217
-
218
-
219
-
220
-
221
-
222
-
223
-
224
-
225
-
226
-
227
-
228
-
229
-
230
-
 231
231 -
 232
232 -
 233
233 -
 234
234 -
 235
235 -
 236
236 -
 237
237 -
 238
238 -
 239
239 -
 240
240 -
 241
241 -
 242
242 -
 243
243 -
 244
244 -
 245
245 -
 246
246 -
 247
247 -
 248
248 -
 249
249 -
 250
250 -
 251
251 -
252
-
253
-
254
-
255
-
256
-
257
-
258
-
259
-
260
-
261
-
262
-
263
-
264
-
265
-
266
-
267
-
268
-
269
-
270
-
271
-
272
 |
 |

section
04
Additional
information
239
Additional information
Annual Report and Accounts 2005
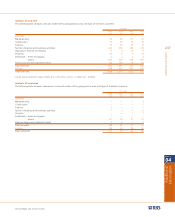
Analysis of deposits – product analysis
The following table shows the distribution of the Group’s deposits by type and geographical area:
IFRS
2005 2004
£m £m
UK
Domestic:
Demand deposits – interest-free 28,833 22,307
Demand deposits – interest-bearing 91,564 72,938
Time deposits – savings 27,091 21,012
Time deposits – other 73,097 76,995
Overseas residents:
Demand deposits – interest-free 396 387
Demand deposits – interest-bearing 26,663 16,965
Time deposits – savings 1,108 1,209
Time deposits – other 53,997 52,629
Total UK offices (1) 302,749 264,442
Overseas
Demand deposits – interest-free 13,248 10,371
Demand deposits – interest-bearing 17,886 12,975
Time deposits – savings 21,691 21,153
Time deposits – other 97,700 74,257
Total overseas offices (see below) 150,525 118,756
Total deposits 453,274 383,198
Held for trading 66,712
Fair value through profit or loss 3,683
Amortised cost 382,879
Banking business 302,383
Trading business 80,815
Total deposits 453,274 383,198
Overseas
US 120,405 86,677
Rest of the World 30,120 32,079
Total overseas 150,525 118,756
Note:
(1) Presentation of product analysis data has been refined and 2004 has been restated onto a basis consistent with 2005.