RBS 2005 Annual Report Download - page 166
Download and view the complete annual report
Please find page 166 of the 2005 RBS annual report below. You can navigate through the pages in the report by either clicking on the pages listed below, or by using the keyword search tool below to find specific information within the annual report.-
 1
1 -
2
-
3
-
4
-
5
-
6
-
7
-
8
-
9
-
10
-
11
-
12
-
13
-
14
-
15
-
16
-
17
-
18
-
19
-
20
-
21
-
22
-
23
-
24
-
25
-
26
-
27
-
28
-
29
-
30
-
31
-
32
-
33
-
34
-
35
-
36
-
37
-
38
-
39
-
40
-
41
-
42
-
43
-
44
-
45
-
46
-
47
-
48
-
49
-
50
-
51
-
52
-
53
-
54
-
55
-
56
-
57
-
58
-
59
-
60
-
61
-
62
-
63
-
64
-
65
-
66
-
67
-
68
-
69
-
70
-
71
-
72
-
73
-
74
-
75
-
76
-
77
-
78
-
79
-
80
-
81
-
82
-
83
-
84
-
85
-
86
-
87
-
88
-
89
-
90
-
91
-
92
-
93
-
94
-
95
-
96
-
97
-
98
-
99
-
100
-
101
-
102
-
103
-
104
-
105
-
106
-
107
-
108
-
109
-
110
-
111
-
112
-
113
-
114
-
115
-
116
-
117
-
118
-
119
-
120
-
121
-
122
-
123
-
124
-
125
-
126
-
127
-
128
-
129
-
130
-
131
-
132
-
133
-
134
-
135
-
136
-
137
-
138
-
139
-
140
-
141
-
142
-
143
-
144
-
145
-
146
-
147
-
148
-
149
-
150
-
151
-
152
-
153
-
154
-
155
-
 156
156 -
 157
157 -
 158
158 -
 159
159 -
 160
160 -
 161
161 -
 162
162 -
 163
163 -
 164
164 -
 165
165 -
 166
166 -
 167
167 -
 168
168 -
 169
169 -
 170
170 -
 171
171 -
 172
172 -
 173
173 -
 174
174 -
 175
175 -
 176
176 -
177
-
178
-
179
-
180
-
181
-
182
-
183
-
184
-
185
-
186
-
187
-
188
-
189
-
190
-
191
-
192
-
193
-
194
-
195
-
196
-
197
-
198
-
199
-
200
-
201
-
202
-
203
-
204
-
205
-
206
-
207
-
208
-
209
-
210
-
211
-
212
-
213
-
214
-
215
-
216
-
217
-
218
-
219
-
220
-
221
-
222
-
223
-
224
-
225
-
226
-
227
-
228
-
229
-
230
-
231
-
232
-
233
-
234
-
235
-
236
-
237
-
238
-
239
-
240
-
241
-
242
-
243
-
244
-
245
-
246
-
247
-
248
-
249
-
250
-
251
-
252
-
253
-
254
-
255
-
256
-
257
-
258
-
259
-
260
-
261
-
262
-
263
-
264
-
265
-
266
-
267
-
268
-
269
-
270
-
271
-
272
 |
 |

164
Notes on the accounts
Notes on the accounts continued
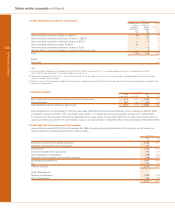
Impairment review
Goodwill
Significant Business 2005 (1) 2004
Division Acquisition Cash generating unit £m £m Basis of valuation Key assumptions
Corporate Markets NatWest* Core corporate banking 1,888 1,888 (2) Earnings
Corporate Markets NatWest* Financial markets 1,563 1,563 (2) Earnings
Retail Banking NatWest* NatWest Retail 3,095 2,721(2) Earnings
Citizens Mellon Mid-Atlantic 1,209 1,197(1)
Citizens Charter One Charter One 4,471 Value-in-use:
(acquired 2004) cash flow
RBS Insurance Churchill Churchill Group 794 775(1) Value-in-use:
cash flow
(1) As at 30 September.
(2) As at 1 January 2004.
* Of the overall goodwill arising from the acquisition of NatWest in 2000, £2.7 billion (2004 – £3.1 billion) has been allocated to cash generating units other than those shown above.
** The key valuation parameters are the same as those used to support the Group’s decision to purchase the businesses.
18 Property, plant and equipment Group
Long Short Computers Operating
Investment Freehold leasehold leasehold and other lease
properties premises premises premises equipment assets Total
2005 £m £m £m £m £m £m £m
Cost or valuation:
At 1 January 2005 4,162 2,878 404 842 3,143 9,447 20,876
Currency translation and other adjustments (55) 17 11 18 67 469 527
Reclassifications (2) 34 (31) — (1) — —
Additions 348 331 25 322 597 3,136 4,759
Subsequent expenditure on investment properties 53 —————53
Change in fair value of investment properties 26 —————26
Disposals and write-off of fully depreciated assets (176) (560) (71) (127) (466) (1,372) (2,772)
Disposals of subsidiaries (9) (19) — (10) (30) (111) (179)
At 31 December 2005 4,347 2,681 338 1,045 3,310 11,569 23,290
Accumulated depreciation and amortisation:
At 1 January 2005 — 417 138 280 1,831 1,782 4,448
Currency translation and other adjustments — 4 — 6 31 141 182
Disposals and write-off of fully depreciated assets — (91) (24) (29) (340) (159) (643)
Disposals of subsidiaries — — — (2) (21) (53) (76)
Depreciation charge for the year — 60 7 64 390 805 1,326
At 31 December 2005 — 390 121 319 1,891 2,516 5,237
Net book value at 31 December 2005 4,347 2,291 217 726 1,419 9,053 18,053
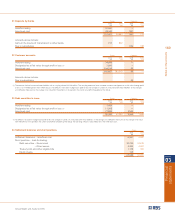
Expected earnings
and cash generation
multiples, including
control premium
Mellon business
typical of recent
transactions in the
same region
Terminal growth rate
after year 7**
Allocation of
common
resources
Terminal growth rate
after year 7**
17 Intangible assets (continued)