RBS 2005 Annual Report Download - page 162
Download and view the complete annual report
Please find page 162 of the 2005 RBS annual report below. You can navigate through the pages in the report by either clicking on the pages listed below, or by using the keyword search tool below to find specific information within the annual report.-
 1
1 -
2
-
3
-
4
-
5
-
6
-
7
-
8
-
9
-
10
-
11
-
12
-
13
-
14
-
15
-
16
-
17
-
18
-
19
-
20
-
21
-
22
-
23
-
24
-
25
-
26
-
27
-
28
-
29
-
30
-
31
-
32
-
33
-
34
-
35
-
36
-
37
-
38
-
39
-
40
-
41
-
42
-
43
-
44
-
45
-
46
-
47
-
48
-
49
-
50
-
51
-
52
-
53
-
54
-
55
-
56
-
57
-
58
-
59
-
60
-
61
-
62
-
63
-
64
-
65
-
66
-
67
-
68
-
69
-
70
-
71
-
72
-
73
-
74
-
75
-
76
-
77
-
78
-
79
-
80
-
81
-
82
-
83
-
84
-
85
-
86
-
87
-
88
-
89
-
90
-
91
-
92
-
93
-
94
-
95
-
96
-
97
-
98
-
99
-
100
-
101
-
102
-
103
-
104
-
105
-
106
-
107
-
108
-
109
-
110
-
111
-
112
-
113
-
114
-
115
-
116
-
117
-
118
-
119
-
120
-
121
-
122
-
123
-
124
-
125
-
126
-
127
-
128
-
129
-
130
-
131
-
132
-
133
-
134
-
135
-
136
-
137
-
138
-
139
-
140
-
141
-
142
-
143
-
144
-
145
-
146
-
147
-
148
-
149
-
150
-
151
-
 152
152 -
 153
153 -
 154
154 -
 155
155 -
 156
156 -
 157
157 -
 158
158 -
 159
159 -
 160
160 -
 161
161 -
 162
162 -
 163
163 -
 164
164 -
 165
165 -
 166
166 -
 167
167 -
 168
168 -
 169
169 -
 170
170 -
 171
171 -
 172
172 -
173
-
174
-
175
-
176
-
177
-
178
-
179
-
180
-
181
-
182
-
183
-
184
-
185
-
186
-
187
-
188
-
189
-
190
-
191
-
192
-
193
-
194
-
195
-
196
-
197
-
198
-
199
-
200
-
201
-
202
-
203
-
204
-
205
-
206
-
207
-
208
-
209
-
210
-
211
-
212
-
213
-
214
-
215
-
216
-
217
-
218
-
219
-
220
-
221
-
222
-
223
-
224
-
225
-
226
-
227
-
228
-
229
-
230
-
231
-
232
-
233
-
234
-
235
-
236
-
237
-
238
-
239
-
240
-
241
-
242
-
243
-
244
-
245
-
246
-
247
-
248
-
249
-
250
-
251
-
252
-
253
-
254
-
255
-
256
-
257
-
258
-
259
-
260
-
261
-
262
-
263
-
264
-
265
-
266
-
267
-
268
-
269
-
270
-
271
-
272
 |
 |

160
Notes on the accounts
Notes on the accounts continued
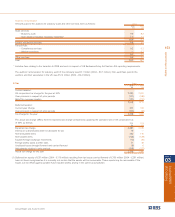
13 Debt securities (continued)
The table below shows the number and fair value of available-for-sale debt-securities that were in an unrealised loss position at
31 December 2005.
Less than 12 months More than 12 months Total
Gross Gross Gross
unrealised unrealised unrealised
Number Fair value losses Fair value losses Fair value losses
Issued by of issues £m £m £m £m £m £m
UK government 9 — — 217 7 217 7
US government, federal agencies and states 511 13,390 228 1,475 35 14,865 263
Other government 54 1,136 7 149 7 1,285 14
Corporates 21 157 3 54 1 211 4
Mortgage-backed securities 110 2,797 55 149 4 2,946 59
Bank and building society 159 5,417 4 156 2 5,573 6
Other 5 — 2 6 — 6 2
869 22,897 299 2,206 56 25,103 355
The Group considers that unrealised losses on available-for-sale debt securities are temporary principally because they reflect
changes in benchmark interest rates.
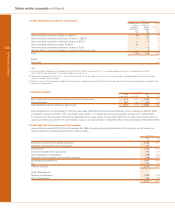
14 Equity shares Group
2005 2004
Listed Unlisted Total Listed Unlisted Total
£m £m £m £m £m £m
Held-for-trading 2,937 4 2,941
Designated as at fair value through profit or loss 2,113 428 2,541
Available-for-sale 704 3,115 3,819
5,754 3,547 9,301
Investment securities 1,213 1,227 2,440
Other securities 2,282 1 2,283
At 31 December 3,495 1,228 4,723
Available-for-sale
Gross unrealised gains 168 54 222
Gross unrealised losses (5) (8) (13)
163 46 209
Investment securities
Book value 1,213 1,227 2,440
Gross unrecognised gains 356 169 525
Gross unrecognised losses (78) (5) (83)
1,491 1,391 2,882
Unquoted equity investments at cost include £1.8 billion attributable to the Group’s investment in Bank of China which was completed
on 31 December 2005. Also included are equity investments in the Federal Home Loans Bank and Federal Reserve Bank that are
redeemable at cost (£0.8 billion). The remaining investments at cost cannot be measured reliably and comprised numerous small
shareholdings including those received on trouble debt restructuring. Disposals in the year generated gains of £85 million.
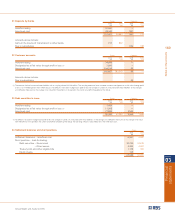
At 31 December 2005 the £13 million gross unrealised losses represented 23 equity issues with fair value of £30 million which were in
an unrealised loss position for less than 12 months.