RBS 2005 Annual Report Download - page 207
Download and view the complete annual report
Please find page 207 of the 2005 RBS annual report below. You can navigate through the pages in the report by either clicking on the pages listed below, or by using the keyword search tool below to find specific information within the annual report.-
 1
1 -
2
-
3
-
4
-
5
-
6
-
7
-
8
-
9
-
10
-
11
-
12
-
13
-
14
-
15
-
16
-
17
-
18
-
19
-
20
-
21
-
22
-
23
-
24
-
25
-
26
-
27
-
28
-
29
-
30
-
31
-
32
-
33
-
34
-
35
-
36
-
37
-
38
-
39
-
40
-
41
-
42
-
43
-
44
-
45
-
46
-
47
-
48
-
49
-
50
-
51
-
52
-
53
-
54
-
55
-
56
-
57
-
58
-
59
-
60
-
61
-
62
-
63
-
64
-
65
-
66
-
67
-
68
-
69
-
70
-
71
-
72
-
73
-
74
-
75
-
76
-
77
-
78
-
79
-
80
-
81
-
82
-
83
-
84
-
85
-
86
-
87
-
88
-
89
-
90
-
91
-
92
-
93
-
94
-
95
-
96
-
97
-
98
-
99
-
100
-
101
-
102
-
103
-
104
-
105
-
106
-
107
-
108
-
109
-
110
-
111
-
112
-
113
-
114
-
115
-
116
-
117
-
118
-
119
-
120
-
121
-
122
-
123
-
124
-
125
-
126
-
127
-
128
-
129
-
130
-
131
-
132
-
133
-
134
-
135
-
136
-
137
-
138
-
139
-
140
-
141
-
142
-
143
-
144
-
145
-
146
-
147
-
148
-
149
-
150
-
151
-
152
-
153
-
154
-
155
-
156
-
157
-
158
-
159
-
160
-
161
-
162
-
163
-
164
-
165
-
166
-
167
-
168
-
169
-
170
-
171
-
172
-
173
-
174
-
175
-
176
-
177
-
178
-
179
-
180
-
181
-
182
-
183
-
184
-
185
-
186
-
187
-
188
-
189
-
190
-
191
-
192
-
193
-
194
-
195
-
196
-
 197
197 -
 198
198 -
 199
199 -
 200
200 -
 201
201 -
 202
202 -
 203
203 -
 204
204 -
 205
205 -
 206
206 -
 207
207 -
 208
208 -
 209
209 -
 210
210 -
 211
211 -
 212
212 -
 213
213 -
 214
214 -
 215
215 -
 216
216 -
 217
217 -
218
-
219
-
220
-
221
-
222
-
223
-
224
-
225
-
226
-
227
-
228
-
229
-
230
-
231
-
232
-
233
-
234
-
235
-
236
-
237
-
238
-
239
-
240
-
241
-
242
-
243
-
244
-
245
-
246
-
247
-
248
-
249
-
250
-
251
-
252
-
253
-
254
-
255
-
256
-
257
-
258
-
259
-
260
-
261
-
262
-
263
-
264
-
265
-
266
-
267
-
268
-
269
-
270
-
271
-
272
 |
 |

section
03
Financial
statements
205
Notes on the accounts
Annual Report and Accounts 2005
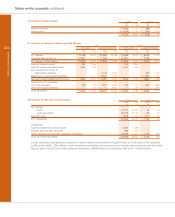
41 Segmental analysis
The directors manage the Group primarily by class of business and present the segmental analysis on that basis. Segments charge
market prices for services rendered to other parts of the Group with the exception of Manufacturing and central resources. The
expenditure incurred by Manufacturing relates to shared costs principally in respect of the Group's UK and Ireland banking and
insurance operations. These costs reflect activities that are shared between the various customer-facing divisions and consequently
cannot be directly attributed to individual divisions. Funding charges between segments are determined by Group Treasury, having
regard to commercial demands.
(a) Divisions
Group
Revenue Total Income
Depreciation Operating
Inter Inter Operating and profit
External segment Total External segment Total expenses amortisation Provisions before tax
2005 £m £m £m £m £m £m £m £m £m £m
Corporate Markets 14,633 3,724 18,357 11,062 (2,247) 8,815 (2,440) (816) (335) 5,224
Retail Banking 7,086 1,333 8,419 5,507 (74) 5,433 (1,810) (13) (601) 3,009
Retail Direct 3,751 183 3,934 2,123 (157) 1,966 (580) (25) (571) 790
Wealth Management 870 1,129 1,999 (235) 1,049 814 (379) (14) (13) 408
Ulster Bank 1,638 150 1,788 973 (115) 858 (246) (24) (58) 530
Citizens 4,878 4 4,882 3,353 (89) 3,264 (1,407) (151) (131) 1,575
RBS Insurance 6,194 67 6,261 5,501 (12) 5,489 (4,536) (27) — 926
Manufacturing 55 6 61 (61) (34) (95) (2,125) (523) — (2,743)
Central items 15 5,161 5,176 (2,654) 1,679 (975) (500) 5 2 (1,468)
Eliminations — (11,757) (11,757)———————
Operating profit before
amortisation of
purchased intangibles,
integration costs and
net gain on sale of
strategic investments 39,120 — 39,120 25,569 — 25,569 (14,023) (1,588) (1,707) 8,251
Amortisation of
intangibles ———————(97)—(97)
Integration costs ——————(318) (140) — (458)
Net gain on sale of
strategic investments 333 — 333 333 — 333 (93) — — 240
Operating profit before tax 39,453 — 39,453 25,902 — 25,902 (14,434) (1,825) (1,707) 7,936
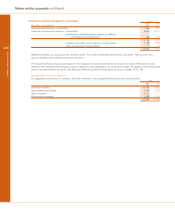
Group
Revenue Total Income
Depreciation Operating
Inter Inter Operating and profit
External segment Total External segment Total expenses amortisation Provisions before tax
2004 £m £m £m £m £m £m £m £m £m £m
Corporate Markets 11,809 4,007 15,816 9,548 (1,897) 7,651 (2,084) (760) (581) 4,226
Retail Banking 6,907 1,283 8,190 5,460 120 5,580 (1,969) (10) (389) 3,212
Retail Direct 3,917 109 4,026 1,933 (156) 1,777 (552) (27) (313) 885
Wealth Management 861 918 1,779 18 755 773 (368) (30) (18) 357
Ulster Bank 1,281 53 1,334 800 (57) 743 (224) (27) (40) 452
Citizens 2,929 15 2,944 2,265 3 2,268 (1,003) (77) (117) 1,071
RBS Insurance 5,630 33 5,663 5,064 (25) 5,039 (4,145) (31) — 863
Manufacturing 43 15 58 (66) — (66) (2,132) (424) — (2,622)
Central items — 2,065 2,065 (1,631) 1,257 (374) (204) 10 (27) (595)
Eliminations — (8,498) (8,498) ———————
Operating profit before
amortisation of
purchased intangibles
and integration costs 33,377 — 33,377 23,391 — 23,391 (12,681) (1,376) (1,485) 7,849
Amortisation of
intangibles ———————(45)—(45)
Integration costs ——————(267) (253) — (520)
Operating profit before tax 33,377 — 33,377 23,391 — 23,391 (12,948) (1,674) (1,485) 7,284