RBS 2005 Annual Report Download - page 78
Download and view the complete annual report
Please find page 78 of the 2005 RBS annual report below. You can navigate through the pages in the report by either clicking on the pages listed below, or by using the keyword search tool below to find specific information within the annual report.-
 1
1 -
2
-
3
-
4
-
5
-
6
-
7
-
8
-
9
-
10
-
11
-
12
-
13
-
14
-
15
-
16
-
17
-
18
-
19
-
20
-
21
-
22
-
23
-
24
-
25
-
26
-
27
-
28
-
29
-
30
-
31
-
32
-
33
-
34
-
35
-
36
-
37
-
38
-
39
-
40
-
41
-
42
-
43
-
44
-
45
-
46
-
47
-
48
-
49
-
50
-
51
-
52
-
53
-
54
-
55
-
56
-
57
-
58
-
59
-
60
-
61
-
62
-
63
-
64
-
65
-
66
-
67
-
 68
68 -
 69
69 -
 70
70 -
 71
71 -
 72
72 -
 73
73 -
 74
74 -
 75
75 -
 76
76 -
 77
77 -
 78
78 -
 79
79 -
 80
80 -
 81
81 -
 82
82 -
 83
83 -
 84
84 -
 85
85 -
 86
86 -
 87
87 -
 88
88 -
89
-
90
-
91
-
92
-
93
-
94
-
95
-
96
-
97
-
98
-
99
-
100
-
101
-
102
-
103
-
104
-
105
-
106
-
107
-
108
-
109
-
110
-
111
-
112
-
113
-
114
-
115
-
116
-
117
-
118
-
119
-
120
-
121
-
122
-
123
-
124
-
125
-
126
-
127
-
128
-
129
-
130
-
131
-
132
-
133
-
134
-
135
-
136
-
137
-
138
-
139
-
140
-
141
-
142
-
143
-
144
-
145
-
146
-
147
-
148
-
149
-
150
-
151
-
152
-
153
-
154
-
155
-
156
-
157
-
158
-
159
-
160
-
161
-
162
-
163
-
164
-
165
-
166
-
167
-
168
-
169
-
170
-
171
-
172
-
173
-
174
-
175
-
176
-
177
-
178
-
179
-
180
-
181
-
182
-
183
-
184
-
185
-
186
-
187
-
188
-
189
-
190
-
191
-
192
-
193
-
194
-
195
-
196
-
197
-
198
-
199
-
200
-
201
-
202
-
203
-
204
-
205
-
206
-
207
-
208
-
209
-
210
-
211
-
212
-
213
-
214
-
215
-
216
-
217
-
218
-
219
-
220
-
221
-
222
-
223
-
224
-
225
-
226
-
227
-
228
-
229
-
230
-
231
-
232
-
233
-
234
-
235
-
236
-
237
-
238
-
239
-
240
-
241
-
242
-
243
-
244
-
245
-
246
-
247
-
248
-
249
-
250
-
251
-
252
-
253
-
254
-
255
-
256
-
257
-
258
-
259
-
260
-
261
-
262
-
263
-
264
-
265
-
266
-
267
-
268
-
269
-
270
-
271
-
272
 |
 |

76
Operating and financial review
Operating and financial review continued
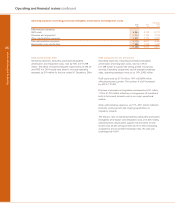
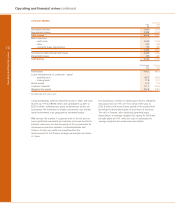
Wealth Management
Pro forma
2005 2004
£m £m
Net interest income 442 410
Non-interest income 372 328
Total income 814 738
Expenses
– staff costs 258 262
– other 135 136
393 398
Contribution before impairment losses 421 340
Impairment losses 13 16
Contribution 408 324
31 December 1 January
2005 2005
£bn £bn
Loans and advances to customers – gross 7.8 7.1
Investment management assets – excluding deposits 25.4 21.6
Customer deposits 25.5 22.3
Weighted risk assets 6.1 6.0
Total income rose by 10% to £814 million, reflecting good
growth across all our businesses, and contribution was 26%
higher at £408 million. Coutts UK and Adam & Co both gained
good numbers of customers, with Coutts up 7% and Adam up
11%. 2005 also saw the continuation of rapid growth in Asia,
where the number of private bankers increased by 20%, with
particular emphasis placed on recruitment for the Chinese and
Indian markets.
Average lending increased by 20% and customer deposits by
11%. This resulted in an 8% increase in net interest income to
£442 million, with net interest margin reduced by the mix of
business.
Non-interest income increased by 13% to £372 million, driven
by investment fees, with average assets under management up
9% to £23.1 billion as a result of good new business volumes
in Coutts UK and the rise in equity markets. Assets under
management at the year end were £25.4 billion, an increase of
18%.
Expenses decreased by 1% to £393 million, reflecting a
continued focus on efficiency. Despite continued investment in
growth markets in both the UK and overseas, staff costs were
2% lower than in 2004 which was affected by a number of
one-off costs. Other costs also decreased slightly.
Impairment losses amounted to £13 million, down £3 million.