RBS 2005 Annual Report Download - page 193
Download and view the complete annual report
Please find page 193 of the 2005 RBS annual report below. You can navigate through the pages in the report by either clicking on the pages listed below, or by using the keyword search tool below to find specific information within the annual report.-
 1
1 -
2
-
3
-
4
-
5
-
6
-
7
-
8
-
9
-
10
-
11
-
12
-
13
-
14
-
15
-
16
-
17
-
18
-
19
-
20
-
21
-
22
-
23
-
24
-
25
-
26
-
27
-
28
-
29
-
30
-
31
-
32
-
33
-
34
-
35
-
36
-
37
-
38
-
39
-
40
-
41
-
42
-
43
-
44
-
45
-
46
-
47
-
48
-
49
-
50
-
51
-
52
-
53
-
54
-
55
-
56
-
57
-
58
-
59
-
60
-
61
-
62
-
63
-
64
-
65
-
66
-
67
-
68
-
69
-
70
-
71
-
72
-
73
-
74
-
75
-
76
-
77
-
78
-
79
-
80
-
81
-
82
-
83
-
84
-
85
-
86
-
87
-
88
-
89
-
90
-
91
-
92
-
93
-
94
-
95
-
96
-
97
-
98
-
99
-
100
-
101
-
102
-
103
-
104
-
105
-
106
-
107
-
108
-
109
-
110
-
111
-
112
-
113
-
114
-
115
-
116
-
117
-
118
-
119
-
120
-
121
-
122
-
123
-
124
-
125
-
126
-
127
-
128
-
129
-
130
-
131
-
132
-
133
-
134
-
135
-
136
-
137
-
138
-
139
-
140
-
141
-
142
-
143
-
144
-
145
-
146
-
147
-
148
-
149
-
150
-
151
-
152
-
153
-
154
-
155
-
156
-
157
-
158
-
159
-
160
-
161
-
162
-
163
-
164
-
165
-
166
-
167
-
168
-
169
-
170
-
171
-
172
-
173
-
174
-
175
-
176
-
177
-
178
-
179
-
180
-
181
-
182
-
 183
183 -
 184
184 -
 185
185 -
 186
186 -
 187
187 -
 188
188 -
 189
189 -
 190
190 -
 191
191 -
 192
192 -
 193
193 -
 194
194 -
 195
195 -
 196
196 -
 197
197 -
 198
198 -
 199
199 -
 200
200 -
 201
201 -
 202
202 -
 203
203 -
204
-
205
-
206
-
207
-
208
-
209
-
210
-
211
-
212
-
213
-
214
-
215
-
216
-
217
-
218
-
219
-
220
-
221
-
222
-
223
-
224
-
225
-
226
-
227
-
228
-
229
-
230
-
231
-
232
-
233
-
234
-
235
-
236
-
237
-
238
-
239
-
240
-
241
-
242
-
243
-
244
-
245
-
246
-
247
-
248
-
249
-
250
-
251
-
252
-
253
-
254
-
255
-
256
-
257
-
258
-
259
-
260
-
261
-
262
-
263
-
264
-
265
-
266
-
267
-
268
-
269
-
270
-
271
-
272
 |
 |

section
03
Financial
statements
191
Notes on the accounts
Annual Report and Accounts 2005
d) Creditor insurance
Creditor insurance contracts are designed to cover
payments on secured or unsecured lending. These
contracts will be for a maximum term of 5 years. The causes
of creditor insurance claims are loss of income through
accident, sickness or unemployment or, in some
circumstances, loss of life.
The main source of uncertainty affecting the Group's
creditor accounts is the economic environment.
Life business
The three regulated life companies of RBSG, NatWest Life
Assurance Limited, Royal Scottish Assurance plc (“RSA”) and
Direct Line Life Limited, are required to meet minimum capital
requirements at all times under the Financial Service
Authority’s Prudential Sourcebook. The capital resources
covering the regulatory requirement are not transferable to
other areas of the Group. To ensure that the capital
requirement is satisfied at all times, each company holds an
additional voluntary buffer above the absolute minimum.
Sufficient capital resources are held to ensure that the capital
requirements are covered over a two year projection period.
Life insurance results are inherently uncertain, due to actual
experience being different to modelled assumptions. Such
differences affect regulatory capital resources, as do varying
levels of new business. Therefore, projections are formally
reviewed twice a year. Where there is a shortfall of capital,
various options are available to provide new capital.
The Group is not exposed to price, currency, credit, or interest
risk on unit linked life contracts but it is exposed to variation in
management fees. A decrease of 10% in the value of the
assets would reduce the asset management fees by £5 million
per annum (2004 – £5 million). The Group also writes insurance
contracts with minimum guaranteed death benefits that expose
it to the risk that declines in the value of underlying investments
may increase the Group’s net exposure to death risk.
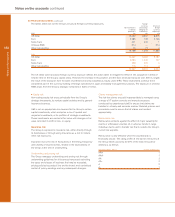
Valuation discount rates 2005 2004
Assurances
Life policies 2.85% 3.00%
Pensions policies 3.80% 4.00%
Annuities in payment (all reinsured) 4.00% 4.67%
Interest rates
Sterling interest 2.85% net 3.0% net
Unit growth 2.85% net 3.0% net
Expense inflation 4.0% net 4.0% net
Mortality assumptions are set with regard to recent experience and general industry trends.
Mortality tables used:
Pre-2001 products – RSA
Term assurances 72% AM80 ult -2 + 33% AIDS R6A
Unit-linked life assurances 76.5% / 72% AM80 ult.-2+ 33% AIDS R6A
Unit-linked pensions 90% AM80 ult.-2
Pre-2000 products – NatWest Life
Term assurances 65% TM80 ultimate + 33% AIDS R6A
Unit-linked assurances 60% AM80 ult.
Rates above are for male, non-smokers.
Post-2000 products
Term assurances 60% TM80 ult + 33% AIDS R6A
Expenses:
2005 2004
Pre-2000 products – RSA per annum per annum
Lifestyle protection plan £29.81 £27.17
Mortgage savings plan £67.05 £60.08
Pre-2000 products – NatWest Life
Term assurances £26.79 £25.13
Single premium unit-linked bonds £23.86 £22.38
Post-2000 products
Term assurances £23.97 £22.38
Guaranteed bonds £26.92 £25.13