RBS 2005 Annual Report Download - page 197
Download and view the complete annual report
Please find page 197 of the 2005 RBS annual report below. You can navigate through the pages in the report by either clicking on the pages listed below, or by using the keyword search tool below to find specific information within the annual report.-
 1
1 -
2
-
3
-
4
-
5
-
6
-
7
-
8
-
9
-
10
-
11
-
12
-
13
-
14
-
15
-
16
-
17
-
18
-
19
-
20
-
21
-
22
-
23
-
24
-
25
-
26
-
27
-
28
-
29
-
30
-
31
-
32
-
33
-
34
-
35
-
36
-
37
-
38
-
39
-
40
-
41
-
42
-
43
-
44
-
45
-
46
-
47
-
48
-
49
-
50
-
51
-
52
-
53
-
54
-
55
-
56
-
57
-
58
-
59
-
60
-
61
-
62
-
63
-
64
-
65
-
66
-
67
-
68
-
69
-
70
-
71
-
72
-
73
-
74
-
75
-
76
-
77
-
78
-
79
-
80
-
81
-
82
-
83
-
84
-
85
-
86
-
87
-
88
-
89
-
90
-
91
-
92
-
93
-
94
-
95
-
96
-
97
-
98
-
99
-
100
-
101
-
102
-
103
-
104
-
105
-
106
-
107
-
108
-
109
-
110
-
111
-
112
-
113
-
114
-
115
-
116
-
117
-
118
-
119
-
120
-
121
-
122
-
123
-
124
-
125
-
126
-
127
-
128
-
129
-
130
-
131
-
132
-
133
-
134
-
135
-
136
-
137
-
138
-
139
-
140
-
141
-
142
-
143
-
144
-
145
-
146
-
147
-
148
-
149
-
150
-
151
-
152
-
153
-
154
-
155
-
156
-
157
-
158
-
159
-
160
-
161
-
162
-
163
-
164
-
165
-
166
-
167
-
168
-
169
-
170
-
171
-
172
-
173
-
174
-
175
-
176
-
177
-
178
-
179
-
180
-
181
-
182
-
183
-
184
-
185
-
186
-
 187
187 -
 188
188 -
 189
189 -
 190
190 -
 191
191 -
 192
192 -
 193
193 -
 194
194 -
 195
195 -
 196
196 -
 197
197 -
 198
198 -
 199
199 -
 200
200 -
 201
201 -
 202
202 -
 203
203 -
 204
204 -
 205
205 -
 206
206 -
 207
207 -
208
-
209
-
210
-
211
-
212
-
213
-
214
-
215
-
216
-
217
-
218
-
219
-
220
-
221
-
222
-
223
-
224
-
225
-
226
-
227
-
228
-
229
-
230
-
231
-
232
-
233
-
234
-
235
-
236
-
237
-
238
-
239
-
240
-
241
-
242
-
243
-
244
-
245
-
246
-
247
-
248
-
249
-
250
-
251
-
252
-
253
-
254
-
255
-
256
-
257
-
258
-
259
-
260
-
261
-
262
-
263
-
264
-
265
-
266
-
267
-
268
-
269
-
270
-
271
-
272
 |
 |

section
03
Financial
statements
195
Notes on the accounts
Annual Report and Accounts 2005
Group
After 3 After 6 After 1
months months year Total Non Fair value
but less but less but less interest interest through Banking Trading
3 months than than than Over 5 earning/ earning/ profit or book book
or less 6 months 1 year 5 years years bearing Yield bearing loss total total Total
2005 £m £m £m £m £m £m % £m £m £m £m £m
Assets
Loans and advances
to banks 15,843 2,100 2,293 85 69 20,390 3.71 4,241 282 24,913 45,674 70,587
Loans and advances
to customers 231,730 14,063 13,045 49,078 32,789 340,705 5.51 15,274 616 356,595 60,631 417,226
Debt securities and
treasury bills 12,416 3,362 994 4,765 16,857 38,394 3.81 469 3,991 42,854 83,649 126,503
Other assets — — — — — — 54,952 2,541 57,493 105,018 162,511
Total assets 259,989 19,525 16,332 53,928 49,715 399,489 5.26 74,936 7,430 481,855 294,972 776,827
Liabilities and equity
Deposits by banks 54,515 2,880 1,507 776 968 60,646 3.97 2,123 — 62,769 47,638 110,407
Customer accounts 232,221 5,715 8,141 7,332 2,909 256,318 2.57 37,817 3,683 297,818 45,049 342,867
Debt securities in issue 65,055 4,212 3,586 957 1,140 74,950 4.18 7 11,068 86,025 4,395 90,420
Subordinated liabilities 3,965 1,492 116 5,749 16,339 27,661 6.84 110 150 27,921 353 28,274
Other liabilities — — — — — — 29,576 — 29,576 139,848 169,424
Shareholders’ equity — — — — — — 33,775 — 33,775 1,660 35,435
Internal funding of
trading business (48,506) (4,913) (1,800) (9) — (55,228) 3.83 (801) — (56,029) 56,029 —
Total liabilities and equity 307,250 9,386 11,550 14,805 21,356 364,347 3.82 102,607 14,901 481,855 294,972 776,827
Interest rate swaps (13,537) (2,849) (1,508) 1,182 16,712 — — —
interest rate sensitivity gap(60,798) 7,290 3,274 40,305 45,071 35,142 (27,671) (7,471)
Cumulative interest rate
sensitivity gap (60,798)(53,508)(50,234) (9,929) 35,142 35,142 7,471
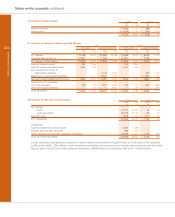
Interest rate sensitivity
The following tables summarise the interest rate sensitivity gap
for the Group and the company at 31 December 2005 and 31
December 2004. The tables show the contractual repricing for
each category of asset, liability and off-balance sheet items in
the banking book. A liability (or negative) gap position exists
when liabilities reprice more quickly or in greater proportion
than assets during a given period and tends to benefit net
interest income in a declining interest rate environment. An
asset (or positive) gap position exists when assets reprice
more quickly or in greater proportion than liabilities during a
given period and tends to benefit net interest income in a rising
interest rate environment. Contractual repricing terms do not
reflect the potential impact of early repayment or withdrawal.
Positions may not be reflective of those in subsequent periods.
Major changes in positions can be made promptly as market
outlooks change. In addition, significant variations in interest
rate sensitivity may exist within the re-pricing periods
presented and among the currencies in which the Group has
interest rate positions.
Trading book
The table below sets out by time band the net effect on the Group’s profit or loss of a basis point (0.01%) increase in interest rates,
assuming all trading positions remained unchanged.
Group
After 3 After 6 After 1
months months year
but less but less but less
3 months than than than Over 5
or less 6 months 1 year 5 years years Total
2005 £’000 £’000 £’000 £’000 £’000 £’000
(Loss)/gain per basis point increase (487) (40) 180 (1,631) 1,146 (832)