RBS 2005 Annual Report Download - page 249
Download and view the complete annual report
Please find page 249 of the 2005 RBS annual report below. You can navigate through the pages in the report by either clicking on the pages listed below, or by using the keyword search tool below to find specific information within the annual report.-
 1
1 -
2
-
3
-
4
-
5
-
6
-
7
-
8
-
9
-
10
-
11
-
12
-
13
-
14
-
15
-
16
-
17
-
18
-
19
-
20
-
21
-
22
-
23
-
24
-
25
-
26
-
27
-
28
-
29
-
30
-
31
-
32
-
33
-
34
-
35
-
36
-
37
-
38
-
39
-
40
-
41
-
42
-
43
-
44
-
45
-
46
-
47
-
48
-
49
-
50
-
51
-
52
-
53
-
54
-
55
-
56
-
57
-
58
-
59
-
60
-
61
-
62
-
63
-
64
-
65
-
66
-
67
-
68
-
69
-
70
-
71
-
72
-
73
-
74
-
75
-
76
-
77
-
78
-
79
-
80
-
81
-
82
-
83
-
84
-
85
-
86
-
87
-
88
-
89
-
90
-
91
-
92
-
93
-
94
-
95
-
96
-
97
-
98
-
99
-
100
-
101
-
102
-
103
-
104
-
105
-
106
-
107
-
108
-
109
-
110
-
111
-
112
-
113
-
114
-
115
-
116
-
117
-
118
-
119
-
120
-
121
-
122
-
123
-
124
-
125
-
126
-
127
-
128
-
129
-
130
-
131
-
132
-
133
-
134
-
135
-
136
-
137
-
138
-
139
-
140
-
141
-
142
-
143
-
144
-
145
-
146
-
147
-
148
-
149
-
150
-
151
-
152
-
153
-
154
-
155
-
156
-
157
-
158
-
159
-
160
-
161
-
162
-
163
-
164
-
165
-
166
-
167
-
168
-
169
-
170
-
171
-
172
-
173
-
174
-
175
-
176
-
177
-
178
-
179
-
180
-
181
-
182
-
183
-
184
-
185
-
186
-
187
-
188
-
189
-
190
-
191
-
192
-
193
-
194
-
195
-
196
-
197
-
198
-
199
-
200
-
201
-
202
-
203
-
204
-
205
-
206
-
207
-
208
-
209
-
210
-
211
-
212
-
213
-
214
-
215
-
216
-
217
-
218
-
219
-
220
-
221
-
222
-
223
-
224
-
225
-
226
-
227
-
228
-
229
-
230
-
231
-
232
-
233
-
234
-
235
-
236
-
237
-
238
-
 239
239 -
 240
240 -
 241
241 -
 242
242 -
 243
243 -
 244
244 -
 245
245 -
 246
246 -
 247
247 -
 248
248 -
 249
249 -
 250
250 -
 251
251 -
 252
252 -
 253
253 -
 254
254 -
 255
255 -
 256
256 -
 257
257 -
 258
258 -
 259
259 -
260
-
261
-
262
-
263
-
264
-
265
-
266
-
267
-
268
-
269
-
270
-
271
-
272
 |
 |

section
04
Additional
information
247
Additional information
Annual Report and Accounts 2005
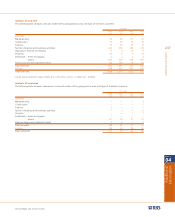
Analysis of write-offs
The following table analyses amounts written-off by geographical area and type of domestic customer.
UK GAAP
2004 2003 2002 2001
£m £m £m £m
Domestic
Manufacturing 55 99 111 61
Construction 12 22 18 19
Finance 19 54 35 8
Service industries and business activities 163 393 180 176
Agriculture, forestry and fishing 9 4 10 5
Property 33 6 9 14
Individuals – home mortgages 4 223
Individuals – others 535 357 333 297
Finance leases and instalment credit 90 160 45 62
Total domestic 920 1,097 743 645
Foreign 548 422 293 190
Total write-offs* 1,468 1,519 1,036 835
* Includes amounts written-off in respect of banks of nil in 2004 (2003 – nil; 2002 – £1 million; 2001 – £6 million).
Analysis of recoveries
The following table analyses recoveries of amounts written-off by geographical area and type of domestic customer.
UK GAAP
2004 2003 2002 2001
£m £m £m £m
Domestic
Manufacturing 1— 1 2
Construction ——— 1
Finance 2 — — 1
Service industries and business activities 1 315
Property —— 1 1
Individuals – home mortgages 1 ———
Individuals – others 81 26 27 41
Finance leases and instalment credit 2 973
Total domestic 88 38 37 54
Foreign 59 34 26 26
Total recoveries 147 72 63 80