RBS 2005 Annual Report Download - page 79
Download and view the complete annual report
Please find page 79 of the 2005 RBS annual report below. You can navigate through the pages in the report by either clicking on the pages listed below, or by using the keyword search tool below to find specific information within the annual report.-
 1
1 -
2
-
3
-
4
-
5
-
6
-
7
-
8
-
9
-
10
-
11
-
12
-
13
-
14
-
15
-
16
-
17
-
18
-
19
-
20
-
21
-
22
-
23
-
24
-
25
-
26
-
27
-
28
-
29
-
30
-
31
-
32
-
33
-
34
-
35
-
36
-
37
-
38
-
39
-
40
-
41
-
42
-
43
-
44
-
45
-
46
-
47
-
48
-
49
-
50
-
51
-
52
-
53
-
54
-
55
-
56
-
57
-
58
-
59
-
60
-
61
-
62
-
63
-
64
-
65
-
66
-
67
-
68
-
 69
69 -
 70
70 -
 71
71 -
 72
72 -
 73
73 -
 74
74 -
 75
75 -
 76
76 -
 77
77 -
 78
78 -
 79
79 -
 80
80 -
 81
81 -
 82
82 -
 83
83 -
 84
84 -
 85
85 -
 86
86 -
 87
87 -
 88
88 -
 89
89 -
90
-
91
-
92
-
93
-
94
-
95
-
96
-
97
-
98
-
99
-
100
-
101
-
102
-
103
-
104
-
105
-
106
-
107
-
108
-
109
-
110
-
111
-
112
-
113
-
114
-
115
-
116
-
117
-
118
-
119
-
120
-
121
-
122
-
123
-
124
-
125
-
126
-
127
-
128
-
129
-
130
-
131
-
132
-
133
-
134
-
135
-
136
-
137
-
138
-
139
-
140
-
141
-
142
-
143
-
144
-
145
-
146
-
147
-
148
-
149
-
150
-
151
-
152
-
153
-
154
-
155
-
156
-
157
-
158
-
159
-
160
-
161
-
162
-
163
-
164
-
165
-
166
-
167
-
168
-
169
-
170
-
171
-
172
-
173
-
174
-
175
-
176
-
177
-
178
-
179
-
180
-
181
-
182
-
183
-
184
-
185
-
186
-
187
-
188
-
189
-
190
-
191
-
192
-
193
-
194
-
195
-
196
-
197
-
198
-
199
-
200
-
201
-
202
-
203
-
204
-
205
-
206
-
207
-
208
-
209
-
210
-
211
-
212
-
213
-
214
-
215
-
216
-
217
-
218
-
219
-
220
-
221
-
222
-
223
-
224
-
225
-
226
-
227
-
228
-
229
-
230
-
231
-
232
-
233
-
234
-
235
-
236
-
237
-
238
-
239
-
240
-
241
-
242
-
243
-
244
-
245
-
246
-
247
-
248
-
249
-
250
-
251
-
252
-
253
-
254
-
255
-
256
-
257
-
258
-
259
-
260
-
261
-
262
-
263
-
264
-
265
-
266
-
267
-
268
-
269
-
270
-
271
-
272
 |
 |

section
01
Operating and
financial review
77
Operating and financial review
Annual Report and Accounts 2005
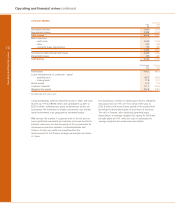
Ulster Bank
Pro forma
2005 2004
£m £m
Net interest income 655 559
Non-interest income 203 190
Total income 858 749
Expenses
– staff costs 191 170
– other 79 74
270 244
Contribution before impairment losses 588 505
Impairment losses 58 45
Contribution 530 460
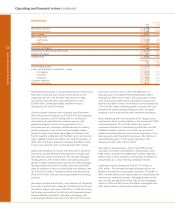
31 December 1 January
2005 2005
£bn £bn
Total assets 35.9 28.7
Loans and advances to customers – gross
– mortgages 13.2 10.1
– other 15.0 12.9
Customer deposits 15.9 13.6
Weighted risk assets 22.4 18.6
Average exchange rate – €/£ 1.463 1.474
Spot exchange rate – €/£ 1.457 1.418
Total income increased by 15% to £858 million, with
contribution also up 15% to £530 million, as Ulster Bank
achieved another year of strong growth, with excellent
customer recruitment, robust lending volumes and very good
growth in deposits. First Active continues to perform well and
in line with our integration plan. It led the Republic of Ireland
market with the introduction of new mortgage products, as well
as launching new credit card and direct loan products.
The number of personal and business customers increased by
68,000 in the year. Ulster Bank personal customer numbers
rose by 9% in the Republic of Ireland, where our switcher
mortgage product has helped us to gain market share. In
Northern Ireland, Ulster Bank significantly enhanced its
personal current account offering in the fourth quarter to
provide free banking to all customers.
Net interest income rose by 17% to £655 million. Average loans
and advances increased by 33% to £25.0 billion and average
customer deposits by 21% to £14.4 billion. The continuing
strong growth in lending, particularly in mortgages and
business loans, led to a decline in net interest margin.
Non-interest income increased by £13 million or 7% to £203
million. This reflected increased volumes of customer
transactions and good growth in income from financial markets
services.
Expenses increased by 11% to £270 million, as a result of
investment to support the growth of the business. This
investment will continue into 2006. We have continued with our
branch improvement programme, upgrading 50 branches in
the Republic of Ireland and 39 in Northern Ireland.
Impairment losses increased by £13 million to £58 million,
reflecting the growth in lending.