RBS 2005 Annual Report Download - page 252
Download and view the complete annual report
Please find page 252 of the 2005 RBS annual report below. You can navigate through the pages in the report by either clicking on the pages listed below, or by using the keyword search tool below to find specific information within the annual report.-
 1
1 -
2
-
3
-
4
-
5
-
6
-
7
-
8
-
9
-
10
-
11
-
12
-
13
-
14
-
15
-
16
-
17
-
18
-
19
-
20
-
21
-
22
-
23
-
24
-
25
-
26
-
27
-
28
-
29
-
30
-
31
-
32
-
33
-
34
-
35
-
36
-
37
-
38
-
39
-
40
-
41
-
42
-
43
-
44
-
45
-
46
-
47
-
48
-
49
-
50
-
51
-
52
-
53
-
54
-
55
-
56
-
57
-
58
-
59
-
60
-
61
-
62
-
63
-
64
-
65
-
66
-
67
-
68
-
69
-
70
-
71
-
72
-
73
-
74
-
75
-
76
-
77
-
78
-
79
-
80
-
81
-
82
-
83
-
84
-
85
-
86
-
87
-
88
-
89
-
90
-
91
-
92
-
93
-
94
-
95
-
96
-
97
-
98
-
99
-
100
-
101
-
102
-
103
-
104
-
105
-
106
-
107
-
108
-
109
-
110
-
111
-
112
-
113
-
114
-
115
-
116
-
117
-
118
-
119
-
120
-
121
-
122
-
123
-
124
-
125
-
126
-
127
-
128
-
129
-
130
-
131
-
132
-
133
-
134
-
135
-
136
-
137
-
138
-
139
-
140
-
141
-
142
-
143
-
144
-
145
-
146
-
147
-
148
-
149
-
150
-
151
-
152
-
153
-
154
-
155
-
156
-
157
-
158
-
159
-
160
-
161
-
162
-
163
-
164
-
165
-
166
-
167
-
168
-
169
-
170
-
171
-
172
-
173
-
174
-
175
-
176
-
177
-
178
-
179
-
180
-
181
-
182
-
183
-
184
-
185
-
186
-
187
-
188
-
189
-
190
-
191
-
192
-
193
-
194
-
195
-
196
-
197
-
198
-
199
-
200
-
201
-
202
-
203
-
204
-
205
-
206
-
207
-
208
-
209
-
210
-
211
-
212
-
213
-
214
-
215
-
216
-
217
-
218
-
219
-
220
-
221
-
222
-
223
-
224
-
225
-
226
-
227
-
228
-
229
-
230
-
231
-
232
-
233
-
234
-
235
-
236
-
237
-
238
-
239
-
240
-
241
-
 242
242 -
 243
243 -
 244
244 -
 245
245 -
 246
246 -
 247
247 -
 248
248 -
 249
249 -
 250
250 -
 251
251 -
 252
252 -
 253
253 -
 254
254 -
 255
255 -
 256
256 -
 257
257 -
 258
258 -
 259
259 -
 260
260 -
 261
261 -
 262
262 -
263
-
264
-
265
-
266
-
267
-
268
-
269
-
270
-
271
-
272
 |
 |

250
Additional information
Additional information continued
Exchange rates
Except as stated, the following tables show, for the dates or periods indicated, the Noon Buying Rate in New York for cable transfers
in sterling as certified for customs’ purposes by the Federal Reserve Bank of New York (the “Noon Buying Rate”):
January December November October September August
US dollars per £1 2006 2005 2005 2005 2005 2005
Noon Buying Rate
High 1.7885 1.7740 1.7755 1.7855 1.8420 1.8148
Low 1.7404 1.7188 1.7138 1.7484 1.7620 1.7695
2005 2004 2003 2002 2001
Noon Buying Rate
Period end rate 1.7188 1.9160 1.7842 1.6095 1.4543
Average rate for the period (1) 1.8147 1.8356 1.6450 1.5043 1.4396
Consolidation rate (2)
Period end rate 1.7214 1.9346 1.7857 1.6128 1.4498
Average rate for the period 1.8198 1.8325 1.6354 1.5032 1.4401
Notes:
(1) The average of the Noon Buying Rates on the last business day of each month during the period.
(2) The rates used by the Group for translating US dollars into sterling in the preparation of its financial statements.
(3) On 24 February 2006, the Noon Buying Rate was £1.00 = US$1.7448.
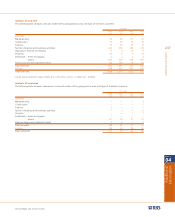
Short term borrowings
UK GAAP
2004 2003
£m £m
Commercial paper
Outstanding at year end 8,391 6,968
Maximum outstanding at any month end during the year 8,391 7,032
Approximate average amount during the year 7,450 5,499
Approximate weighted average interest rate during the year 1.9% 1.6%
Approximate weighted average interest rate at year end 2.6% 1.5%
Other short term borrowings
Outstanding at year end 95,381 84,795
Maximum outstanding at any month end during the year 96,356 94,570
Approximate average amount during the year 85,496 78,004
Approximate weighted average interest rate during the year 2.9% 2.2%
Approximate weighted average interest rate at year end 3.1% 2.0%
Average interest rates during the year are computed by
dividing total interest expense by the average amount
borrowed. Average interest rates at year end are average rates
for a single day and as such may reflect one-day market
distortions which may not be indicative of generally prevailing
rates. Original maturities of commercial paper are not in
excess of one year. ‘Other short-term borrowings’ consist
principally of borrowings in the money markets included within
‘Deposits by banks’ and ‘Customer accounts’ in the accounts,
and generally have original maturities of one year or less.