RBS 2005 Annual Report Download - page 170
Download and view the complete annual report
Please find page 170 of the 2005 RBS annual report below. You can navigate through the pages in the report by either clicking on the pages listed below, or by using the keyword search tool below to find specific information within the annual report.-
 1
1 -
2
-
3
-
4
-
5
-
6
-
7
-
8
-
9
-
10
-
11
-
12
-
13
-
14
-
15
-
16
-
17
-
18
-
19
-
20
-
21
-
22
-
23
-
24
-
25
-
26
-
27
-
28
-
29
-
30
-
31
-
32
-
33
-
34
-
35
-
36
-
37
-
38
-
39
-
40
-
41
-
42
-
43
-
44
-
45
-
46
-
47
-
48
-
49
-
50
-
51
-
52
-
53
-
54
-
55
-
56
-
57
-
58
-
59
-
60
-
61
-
62
-
63
-
64
-
65
-
66
-
67
-
68
-
69
-
70
-
71
-
72
-
73
-
74
-
75
-
76
-
77
-
78
-
79
-
80
-
81
-
82
-
83
-
84
-
85
-
86
-
87
-
88
-
89
-
90
-
91
-
92
-
93
-
94
-
95
-
96
-
97
-
98
-
99
-
100
-
101
-
102
-
103
-
104
-
105
-
106
-
107
-
108
-
109
-
110
-
111
-
112
-
113
-
114
-
115
-
116
-
117
-
118
-
119
-
120
-
121
-
122
-
123
-
124
-
125
-
126
-
127
-
128
-
129
-
130
-
131
-
132
-
133
-
134
-
135
-
136
-
137
-
138
-
139
-
140
-
141
-
142
-
143
-
144
-
145
-
146
-
147
-
148
-
149
-
150
-
151
-
152
-
153
-
154
-
155
-
156
-
157
-
158
-
159
-
 160
160 -
 161
161 -
 162
162 -
 163
163 -
 164
164 -
 165
165 -
 166
166 -
 167
167 -
 168
168 -
 169
169 -
 170
170 -
 171
171 -
 172
172 -
 173
173 -
 174
174 -
 175
175 -
 176
176 -
 177
177 -
 178
178 -
 179
179 -
 180
180 -
181
-
182
-
183
-
184
-
185
-
186
-
187
-
188
-
189
-
190
-
191
-
192
-
193
-
194
-
195
-
196
-
197
-
198
-
199
-
200
-
201
-
202
-
203
-
204
-
205
-
206
-
207
-
208
-
209
-
210
-
211
-
212
-
213
-
214
-
215
-
216
-
217
-
218
-
219
-
220
-
221
-
222
-
223
-
224
-
225
-
226
-
227
-
228
-
229
-
230
-
231
-
232
-
233
-
234
-
235
-
236
-
237
-
238
-
239
-
240
-
241
-
242
-
243
-
244
-
245
-
246
-
247
-
248
-
249
-
250
-
251
-
252
-
253
-
254
-
255
-
256
-
257
-
258
-
259
-
260
-
261
-
262
-
263
-
264
-
265
-
266
-
267
-
268
-
269
-
270
-
271
-
272
 |
 |

168
Notes on the accounts
Notes on the accounts continued
Group
Unrecognised Deferred
gains and gains and
losses losses
2004 £m £m
As at 1 January 2004 – gains 2,236 213
– losses (2,205) (34)
31 179
Recognised gains that arose in previous periods (781) (65)
Recognised losses that arose in previous periods 537 4
Unrecognised gains and losses arising in the year 224 —
Unrecognised gains and losses deferred in the year 61 (61)
Unrecognised gains and losses deferred and taken to profit or loss in the year — (30)
At 31 December 2004 72 27
Of which – gains 1,571 483
– losses (1,499) (456)
72 27
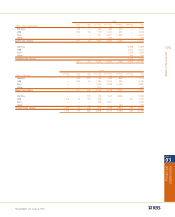
Maturity of replacement cost of over-the-counter contracts (trading and non-trading)
Replacement cost indicates the Group’s derivatives credit exposure. The following table sets forth the gross positive fair values by
maturity. The replacement cost of internal trades is not included as there is no credit risk associated with them.
Group
Within One to Over
one year five years five years Total
2004 £m £m £m £m
Before netting
Exchange rate contracts 21,812 5,414 2,018 29,244
Interest rate contracts 6,777 24,932 27,287 58,996
Credit derivatives — 107 157 264
Equity and commodity contracts 604 777 13 1,394
29,193 31,230 29,475 89,898
Financial institutions 70,417
Others 19,481
89,898
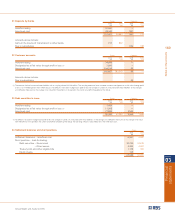
20 Prepayments, accrued income and other assets Group Company
2005 2004 2005 2004
£m £m £m £m
Prepayments 1,274 1,505 ——
Accrued income 857 4,541 —208
Deferred expenses 372 898 ——
Other assets 6,295 4,668 147 110
8,798 11,612 147 318
Amounts above include:
Due from subsidiaries — 313
19 Derivatives at fair value (continued)