RBS 2005 Annual Report Download - page 190
Download and view the complete annual report
Please find page 190 of the 2005 RBS annual report below. You can navigate through the pages in the report by either clicking on the pages listed below, or by using the keyword search tool below to find specific information within the annual report.-
 1
1 -
2
-
3
-
4
-
5
-
6
-
7
-
8
-
9
-
10
-
11
-
12
-
13
-
14
-
15
-
16
-
17
-
18
-
19
-
20
-
21
-
22
-
23
-
24
-
25
-
26
-
27
-
28
-
29
-
30
-
31
-
32
-
33
-
34
-
35
-
36
-
37
-
38
-
39
-
40
-
41
-
42
-
43
-
44
-
45
-
46
-
47
-
48
-
49
-
50
-
51
-
52
-
53
-
54
-
55
-
56
-
57
-
58
-
59
-
60
-
61
-
62
-
63
-
64
-
65
-
66
-
67
-
68
-
69
-
70
-
71
-
72
-
73
-
74
-
75
-
76
-
77
-
78
-
79
-
80
-
81
-
82
-
83
-
84
-
85
-
86
-
87
-
88
-
89
-
90
-
91
-
92
-
93
-
94
-
95
-
96
-
97
-
98
-
99
-
100
-
101
-
102
-
103
-
104
-
105
-
106
-
107
-
108
-
109
-
110
-
111
-
112
-
113
-
114
-
115
-
116
-
117
-
118
-
119
-
120
-
121
-
122
-
123
-
124
-
125
-
126
-
127
-
128
-
129
-
130
-
131
-
132
-
133
-
134
-
135
-
136
-
137
-
138
-
139
-
140
-
141
-
142
-
143
-
144
-
145
-
146
-
147
-
148
-
149
-
150
-
151
-
152
-
153
-
154
-
155
-
156
-
157
-
158
-
159
-
160
-
161
-
162
-
163
-
164
-
165
-
166
-
167
-
168
-
169
-
170
-
171
-
172
-
173
-
174
-
175
-
176
-
177
-
178
-
179
-
 180
180 -
 181
181 -
 182
182 -
 183
183 -
 184
184 -
 185
185 -
 186
186 -
 187
187 -
 188
188 -
 189
189 -
 190
190 -
 191
191 -
 192
192 -
 193
193 -
 194
194 -
 195
195 -
 196
196 -
 197
197 -
 198
198 -
 199
199 -
 200
200 -
201
-
202
-
203
-
204
-
205
-
206
-
207
-
208
-
209
-
210
-
211
-
212
-
213
-
214
-
215
-
216
-
217
-
218
-
219
-
220
-
221
-
222
-
223
-
224
-
225
-
226
-
227
-
228
-
229
-
230
-
231
-
232
-
233
-
234
-
235
-
236
-
237
-
238
-
239
-
240
-
241
-
242
-
243
-
244
-
245
-
246
-
247
-
248
-
249
-
250
-
251
-
252
-
253
-
254
-
255
-
256
-
257
-
258
-
259
-
260
-
261
-
262
-
263
-
264
-
265
-
266
-
267
-
268
-
269
-
270
-
271
-
272
 |
 |

188
Notes on the accounts
Notes on the accounts continued
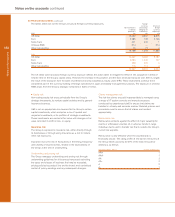
The tables below set out the Group’s structural foreign currency exposures. Foreign
currency Structural
Net investments borrowings foreign
in foreign hedging net currency
operations investments exposures
2005 £m £m £m
US dollar 15,452 6,637 8,815
Euro 2,285 139 2,146
Swiss franc 431 430 1
Chinese RMB 914 — 914
Other non-sterling 76 72 4
19,158 7,278 11,880
2004
US dollar 12,367 6,580 5,787
Euro 2,086 1,349 737
Swiss franc 398 392 6
Other non-sterling 116 112 4
14,967 8,433 6,534
The US dollar open structural foreign currency exposure reflects the action taken to mitigate the effect of the acquisition in 2004 of
Charter One on the Group’s capital ratios. However, the increase in this position and the Euro structural exposure over 2004 is largely
the result of the exclusion from the table of preference shares classified as equity under IFRS. These instruments continue to be
considered part of the currency funding of foreign operations for asset and liability management purposes. The exposure in Chinese
RMB arises from the Group’s strategic investment in Bank of China.
●Equity risk
Non-trading equity risk arises principally from the Group’s
strategic investments, its venture capital activities and its general
insurance business.
VaR is not an appropriate risk measure for the Group’s venture
capital investments, which comprise a mix of quoted and
unquoted investments, or its portfolio of strategic investments.
These investments are carried at fair value with changes in fair
value recorded in profit or loss, or equity.
Insurance risk
The Group is exposed to insurance risk, either directly through
its businesses or through using insurance as a tool to reduce
other risk exposures.
Insurance risk is the risk of fluctuations in the timing, frequency
and severity of insured events, relative to the expectations of
the Group at the time of underwriting.
Underwriting and pricing risk
The Group manages underwriting and pricing risk through
underwriting guidelines for all business transacted restricting
the types and classes of business that may be accepted;
pricing policies by product line and by brand; and centralised
control of policy wordings and any subsequent changes.
Claims management risk
The risk that claims are paid inappropriately is managed using
a range of IT system controls and manual processes
conducted by experienced staff, to ensure that claims are
handled in a timely and accurate manner. Detailed policies and
procedures exist to ensure that all claims are handled
appropriately.
Reinsurance risk
Reinsurance protects against the effect of major catastrophic
events or unforeseen volumes of, or adverse trends in, large
individual claims and to transfer risk that is outside the Group’s
current risk appetite.
Reinsurance is only effective when the counterparty is
financially secure. The rating profile of the top ten reinsurers of
the Group which accounts for 67% of the total reinsurance
debtors is as follows:
Standard & Poor’s Rating Number of Reinsurers
AAA 1
AAA- 1
AA 3
AA- 2
A2
A- 1
34 Financial instruments (continued)