RBS 2005 Annual Report Download - page 160
Download and view the complete annual report
Please find page 160 of the 2005 RBS annual report below. You can navigate through the pages in the report by either clicking on the pages listed below, or by using the keyword search tool below to find specific information within the annual report.-
 1
1 -
2
-
3
-
4
-
5
-
6
-
7
-
8
-
9
-
10
-
11
-
12
-
13
-
14
-
15
-
16
-
17
-
18
-
19
-
20
-
21
-
22
-
23
-
24
-
25
-
26
-
27
-
28
-
29
-
30
-
31
-
32
-
33
-
34
-
35
-
36
-
37
-
38
-
39
-
40
-
41
-
42
-
43
-
44
-
45
-
46
-
47
-
48
-
49
-
50
-
51
-
52
-
53
-
54
-
55
-
56
-
57
-
58
-
59
-
60
-
61
-
62
-
63
-
64
-
65
-
66
-
67
-
68
-
69
-
70
-
71
-
72
-
73
-
74
-
75
-
76
-
77
-
78
-
79
-
80
-
81
-
82
-
83
-
84
-
85
-
86
-
87
-
88
-
89
-
90
-
91
-
92
-
93
-
94
-
95
-
96
-
97
-
98
-
99
-
100
-
101
-
102
-
103
-
104
-
105
-
106
-
107
-
108
-
109
-
110
-
111
-
112
-
113
-
114
-
115
-
116
-
117
-
118
-
119
-
120
-
121
-
122
-
123
-
124
-
125
-
126
-
127
-
128
-
129
-
130
-
131
-
132
-
133
-
134
-
135
-
136
-
137
-
138
-
139
-
140
-
141
-
142
-
143
-
144
-
145
-
146
-
147
-
148
-
149
-
 150
150 -
 151
151 -
 152
152 -
 153
153 -
 154
154 -
 155
155 -
 156
156 -
 157
157 -
 158
158 -
 159
159 -
 160
160 -
 161
161 -
 162
162 -
 163
163 -
 164
164 -
 165
165 -
 166
166 -
 167
167 -
 168
168 -
 169
169 -
 170
170 -
171
-
172
-
173
-
174
-
175
-
176
-
177
-
178
-
179
-
180
-
181
-
182
-
183
-
184
-
185
-
186
-
187
-
188
-
189
-
190
-
191
-
192
-
193
-
194
-
195
-
196
-
197
-
198
-
199
-
200
-
201
-
202
-
203
-
204
-
205
-
206
-
207
-
208
-
209
-
210
-
211
-
212
-
213
-
214
-
215
-
216
-
217
-
218
-
219
-
220
-
221
-
222
-
223
-
224
-
225
-
226
-
227
-
228
-
229
-
230
-
231
-
232
-
233
-
234
-
235
-
236
-
237
-
238
-
239
-
240
-
241
-
242
-
243
-
244
-
245
-
246
-
247
-
248
-
249
-
250
-
251
-
252
-
253
-
254
-
255
-
256
-
257
-
258
-
259
-
260
-
261
-
262
-
263
-
264
-
265
-
266
-
267
-
268
-
269
-
270
-
271
-
272
 |
 |

158
Notes on the accounts
Notes on the accounts continued
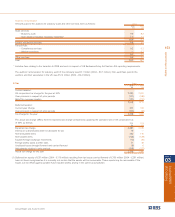
Key economic assumptions used in measuring the value of retained interests at the date of securitisation resulting from
securitisations completed during the year were as follows:
U.S. Agency Consumer Commercial
retained retained retained
Assumptions interests interests interests
Prepayment speed 139 – 690 PSA 16 – 44% CPR (1) 0 – 100 CPY (1)
Weighted average life 1 – 20 years 1 – 10 years 1 – 20 years
Cash flow discount rate 0 – 26% 4 – 90% 5 – 81%
Credit losses N/A (3) 0 – 2% CDR (4) N/A (5)
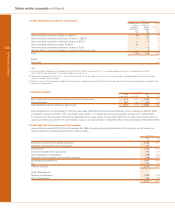
Key economic assumptions and the sensitivity of the current fair value of retained interests at 31 December 2005 to immediate
adverse changes, as indicated below, in those assumptions are as follows:
U.S. Agency Consumer Commercial
retained retained retained
Assumptions/impact on fair value interests interests interests
Fair value of retained interests at 31 December 2004 £1,179 million £764 million £128 million
Prepayment speed(6) 9 – 25% CPR(1) 16 – 80% CPR (1) 0 – 75 CPY (2)
Impact on fair value of 10% adverse change £0.5 million £26.1 million —
Impact on fair value of 20% adverse change £0.6 million £47.1 million —
Weighted average life 0 – 19 years 1 – 10 years 1 – 20 years
Cash flow discount rate 0 – 26% 4 – 96% 5 – 81%
Impact on fair value of 10% adverse change £33.5 million £23.8 million £4.7 million
Impact on fair value of 20% adverse change £65.1 million £46.0 million £9.1 million
Credit losses N/A(3) 0 – 2% CDR(4) N/A(5)
Impact on fair value of 10% adverse change N/A £10.9 million N/A
Impact on fair value of 20% adverse change N/A £19.8 million N/A
Notes:
(1) Constant prepayment rate – the CPR range represents the low and high points of a dynamic CPR curve.
(2) CPR with yield maintenance provision and thus prepayment risk is limited.
(3) Population consists of securities whose collateral is guaranteed by US Government sponsored entities and therefore, no credit loss has been assumed.
(4) Constant default rate.
(5) Population consists of only investment grade senior tranches; therefore, no credit losses are included in the assumptions.
(6) Prepayment speed has been stressed on an overall portfolio basis for US Agency retained interests due to the overall homogeneous nature of the collateral. Consumer and
commercial retained interests have been stressed on a security level basis.
The sensitivities depicted in the preceding table are hypothetical and should be used with caution. The likelihood of those percent
variations selected for sensitivity testing is not necessarily indicative of expected market movements because the relationship of the
change in the assumptions to the change in fair value may not be linear. Also, the effect of a variation in a particular assumption on
the fair value of a retained interest is calculated without changing any other assumptions. This might not be the case in actual market
conditions since changes in one factor might result in changes to other factors. Further, the sensitivities depicted above do not
consider any corrective actions that the Group might take to mitigate the effect of any adverse changes in one or more key
assumptions.
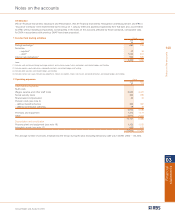
Mortgage-backed securities
The Group sells originated mortgage loans to US Agencies in
return for securities backed by these loans and guaranteed by
the Agency whilst retaining the rights to service the mortgages.
These securities may be subsequently sold. The purchaser has
recourse to the Group for losses up to pre-determined levels
on certain designated mortgages. The Group is not obliged,
and does not intend, to support losses that may be suffered by
the Agencies. Under the terms of the sale agreements, the
Agencies have agreed to seek repayment only from the cash
from the mortgage loans. Once the securities exchanged for
the loans have been sold the Group’s exposure is restricted to
the amount of the recourse. At 31 December 2005 mortgages
amounting to £385 million (2004 - £472 million) had been sold
with recourse and the related securities sold. These loans
have been derecognised; they qualified for the linked
presentation under previous GAAP.
12 Loans and advances to customers (continued)