BB&T 2013 Annual Report Download - page 101
Download and view the complete annual report
Please find page 101 of the 2013 BB&T annual report below. You can navigate through the pages in the report by either clicking on the pages listed below, or by using the keyword search tool below to find specific information within the annual report.-
 1
1 -
2
-
3
-
4
-
5
-
6
-
7
-
8
-
9
-
10
-
11
-
12
-
13
-
14
-
15
-
16
-
17
-
18
-
19
-
20
-
21
-
22
-
23
-
24
-
25
-
26
-
27
-
28
-
29
-
30
-
31
-
32
-
33
-
34
-
35
-
36
-
37
-
38
-
39
-
40
-
41
-
42
-
43
-
44
-
45
-
46
-
47
-
48
-
49
-
50
-
51
-
52
-
53
-
54
-
55
-
56
-
57
-
58
-
59
-
60
-
61
-
62
-
63
-
64
-
65
-
66
-
67
-
68
-
69
-
70
-
71
-
72
-
73
-
74
-
75
-
76
-
77
-
78
-
79
-
80
-
81
-
82
-
83
-
84
-
85
-
86
-
87
-
88
-
89
-
90
-
 91
91 -
 92
92 -
 93
93 -
 94
94 -
 95
95 -
 96
96 -
 97
97 -
 98
98 -
 99
99 -
 100
100 -
 101
101 -
 102
102 -
 103
103 -
 104
104 -
 105
105 -
 106
106 -
 107
107 -
 108
108 -
 109
109 -
 110
110 -
 111
111 -
112
-
113
-
114
-
115
-
116
-
117
-
118
-
119
-
120
-
121
-
122
-
123
-
124
-
125
-
126
-
127
-
128
-
129
-
130
-
131
-
132
-
133
-
134
-
135
-
136
-
137
-
138
-
139
-
140
-
141
-
142
-
143
-
144
-
145
-
146
-
147
-
148
-
149
-
150
-
151
-
152
-
153
-
154
-
155
-
156
-
157
-
158
 |
 |
101
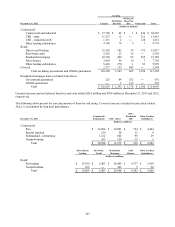
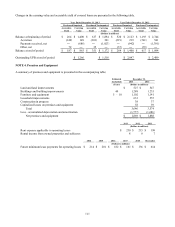
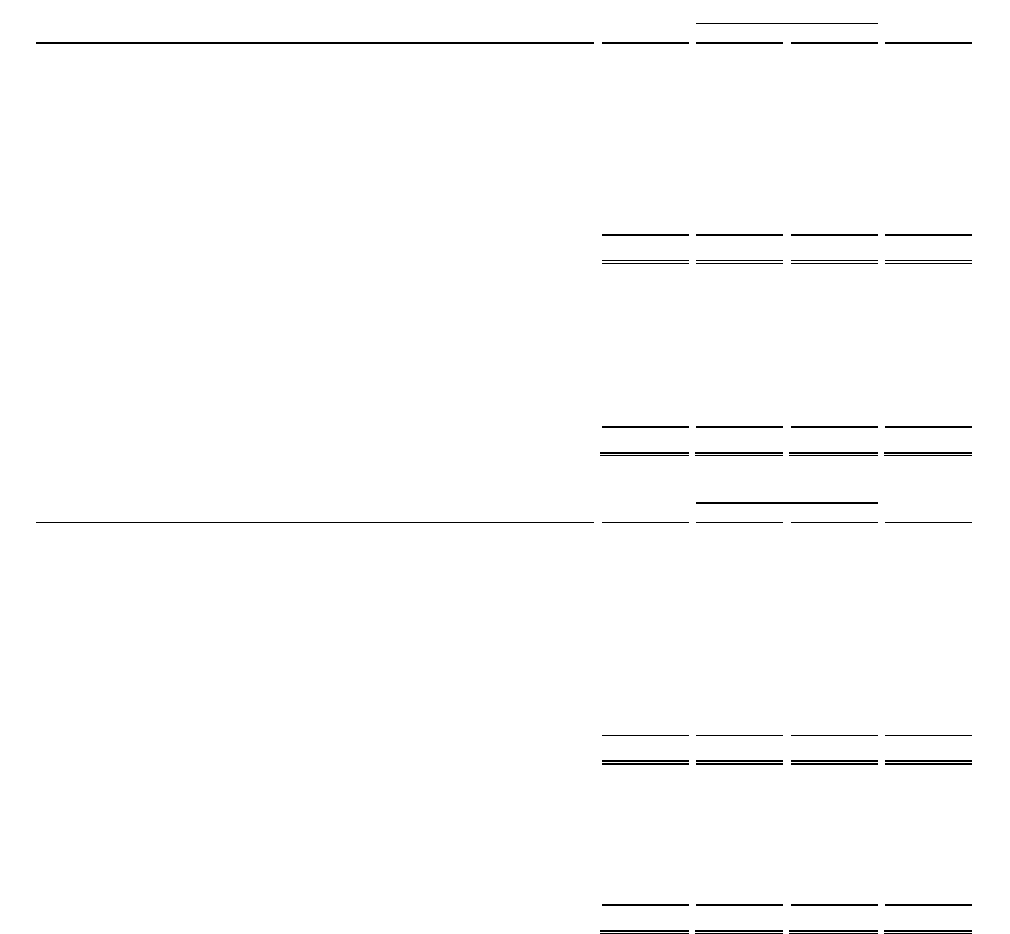
NOTE 2. Securities
Amortized Gross Unrealized Fair
December 31, 2013 Cost Gains Losses Value
(Dollars in millions)
AFS securities:
U.S. Treasury $595 $ — $ — $ 595
MBS issued by GSE 18,397 78 546 17,929
States and political subdivisions 1,877 65 91 1,851
N
on-agency MBS 264 27 — 291
Other 46 — 1 45
Covered 989 404 — 1,393
Total AFS securities $ 22,168 $ 574 $ 638 $ 22,104
HTM securities:
U.S. Treasury $ 392 $ — $ 8 $ 384
GSE 5,603 2 397 5,208
MBS issued by GSE 11,636 38 220 11,454
States and political subdivisions 33 2 — 35
Other 437 12 — 449
Total HTM securities $ 18,101 $ 54 $ 625 $ 17,530
Amortized Gross Unrealized Fair
December 31, 2012 Cost Gains Losses Value
(Dollars in millions)
AFS securities:
U.S. Treasury $281 $ — $ — $ 281
GSE 9 — — 9
MBS issued by GSE 20,482 466 18 20,930
States and political subdivisions 1,948 153 90 2,011
N
on-agency MBS 307 16 11 312
Other 3 — — 3
Covered securities 1,147 444 — 1,591
Total AFS securities $ 24,177 $ 1,079 $ 119 $ 25,137
HTM securities:
GSE $ 3,808 $ 17 $ 1 $ 3,824
MBS issued by GSE 9,273 238 1 9,510
States and political subdivisions 34 1 1 34
Other 479 4 3 480
Total HTM securities $ 13,594 $ 260 $ 6 $ 13,848
As of December 31, 2013 and December 31, 2012, the fair value of covered securities included $1.1 billion and $1.3 billion,
respectively, of non-agency MBS and $314 million and $326 million, respectively, of municipal securities.
As of December 31, 2013 and December 31, 2012, securities with carrying values of approximately $11.9 billion and $19.0
billion, respectively, were pledged to secure municipal deposits, securities sold under agreements to repurchase, other
borrowings, and for other purposes as required or permitted by law.
Certain investments in marketable debt securities and MBS issued by FNMA and FHLMC exceeded ten percent of
shareholders’ equity at December 31, 2013. The FNMA investments had total amortized cost and fair value of $13.2 billion
and $12.7 billion, respectively. The FHLMC investments had total amortized cost and fair value of $7.1 billion and $7.0
billion, respectively.