BB&T 2013 Annual Report Download - page 42
Download and view the complete annual report
Please find page 42 of the 2013 BB&T annual report below. You can navigate through the pages in the report by either clicking on the pages listed below, or by using the keyword search tool below to find specific information within the annual report.-
 1
1 -
2
-
3
-
4
-
5
-
6
-
7
-
8
-
9
-
10
-
11
-
12
-
13
-
14
-
15
-
16
-
17
-
18
-
19
-
20
-
21
-
22
-
23
-
24
-
25
-
26
-
27
-
28
-
29
-
30
-
31
-
 32
32 -
 33
33 -
 34
34 -
 35
35 -
 36
36 -
 37
37 -
 38
38 -
 39
39 -
 40
40 -
 41
41 -
 42
42 -
 43
43 -
 44
44 -
 45
45 -
 46
46 -
 47
47 -
 48
48 -
 49
49 -
 50
50 -
 51
51 -
 52
52 -
53
-
54
-
55
-
56
-
57
-
58
-
59
-
60
-
61
-
62
-
63
-
64
-
65
-
66
-
67
-
68
-
69
-
70
-
71
-
72
-
73
-
74
-
75
-
76
-
77
-
78
-
79
-
80
-
81
-
82
-
83
-
84
-
85
-
86
-
87
-
88
-
89
-
90
-
91
-
92
-
93
-
94
-
95
-
96
-
97
-
98
-
99
-
100
-
101
-
102
-
103
-
104
-
105
-
106
-
107
-
108
-
109
-
110
-
111
-
112
-
113
-
114
-
115
-
116
-
117
-
118
-
119
-
120
-
121
-
122
-
123
-
124
-
125
-
126
-
127
-
128
-
129
-
130
-
131
-
132
-
133
-
134
-
135
-
136
-
137
-
138
-
139
-
140
-
141
-
142
-
143
-
144
-
145
-
146
-
147
-
148
-
149
-
150
-
151
-
152
-
153
-
154
-
155
-
156
-
157
-
158
 |
 |

42
Covered securities are classified as AFS and carried at fair market value. The changes in unrealized gains/losses are
offset by the applicable loss share percentage in AOCI, which resulted in a liability of $375 million as of December
31, 2013.
BB&T would only owe these amounts to the FDIC if BB&T were to sell these securities prior to the third quarter of
2017. BB&T has no current intent to dispose of the covered securities.
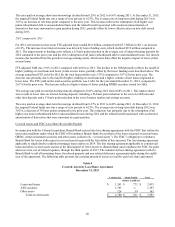
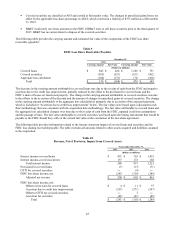
The following table provides the carrying amount and estimated fair value of the components of the FDIC loss share
receivable (payable):
Table 9
FDIC Loss Share Receivable (Payable)
December 31,
2013 2012
Carrying Amount Fair Value Carrying Amount Fair Value
(Dollars in millions)
Covered loans $ 843 $ 464 $ 1,106 $ 751
Covered securities (565) (521) (553) (502)
Aggregate loss calculation (104) (131) (74) (100)
Total $ 174 $ (188) $ 479 $ 149
The decrease in the carrying amount attributable to covered loans was due to the receipt of cash from the FDIC and negative
accretion due to the credit loss improvement, partially reduced by the offset to the provision for covered loans and the
FDIC’s share of losses on foreclosed property. The change in the carrying amount attributable to covered securities was due
to the offsets to the accretion of the discount and the amount of changes in unrealized gains of covered securities. The change
in the carrying amount attributable to the aggregate loss calculation is primarily due to accretion of the expected payment,
which is included in “Accretion due to credit loss improvement” below. The fair values were based upon a discounted cash
flow methodology that was consistent with the acquisition date methodology. The fair value attributable to covered loans and
the aggregate loss calculation changes over time due to the receipt of cash from the FDIC, updated credit loss assumptions
and the passage of time. The fair value attributable to covered securities was based upon the timing and amount that would be
payable to the FDIC should they settle at the current fair value at the conclusion of the loss share agreement.
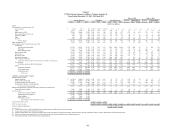
The following table provides information related to the income statement impact of covered loans and securities and the
FDIC loss sharing receivable/payable. The table excludes all amounts related to other assets acquired and liabilities assumed
in the acquisition.
Table 10
Revenue, Net of Provision, Impact from Covered Assets
Years Ended December 31,
2013 2012 2011
(Dollars in millions)
Interest income-covered loans $ 451 $ 765 $ 1,053
Interest income-covered securities 137 172 168
Total interest income 588 937 1,221
Provision for covered loans (5) (13) (71)
OTTI for covered securities ― (4) ―
FDIC loss share income, net (293) (318) (289)
Adjusted net revenue $ 290 $ 602 $ 861
FDIC loss share income, net:
Offset to provision for covered loans $ 4 $ 11 $ 57
Accretion due to credit loss improvement (255) (271) (297)
Offset to OTTI for covered securities ― 3 ―
Accretion for securities (42) (61) (49)
Total $ (293) $ (318) $ (289)