BB&T 2013 Annual Report Download - page 56
Download and view the complete annual report
Please find page 56 of the 2013 BB&T annual report below. You can navigate through the pages in the report by either clicking on the pages listed below, or by using the keyword search tool below to find specific information within the annual report.-
 1
1 -
2
-
3
-
4
-
5
-
6
-
7
-
8
-
9
-
10
-
11
-
12
-
13
-
14
-
15
-
16
-
17
-
18
-
19
-
20
-
21
-
22
-
23
-
24
-
25
-
26
-
27
-
28
-
29
-
30
-
31
-
32
-
33
-
34
-
35
-
36
-
37
-
38
-
39
-
40
-
41
-
42
-
43
-
44
-
45
-
 46
46 -
 47
47 -
 48
48 -
 49
49 -
 50
50 -
 51
51 -
 52
52 -
 53
53 -
 54
54 -
 55
55 -
 56
56 -
 57
57 -
 58
58 -
 59
59 -
 60
60 -
 61
61 -
 62
62 -
 63
63 -
 64
64 -
 65
65 -
 66
66 -
67
-
68
-
69
-
70
-
71
-
72
-
73
-
74
-
75
-
76
-
77
-
78
-
79
-
80
-
81
-
82
-
83
-
84
-
85
-
86
-
87
-
88
-
89
-
90
-
91
-
92
-
93
-
94
-
95
-
96
-
97
-
98
-
99
-
100
-
101
-
102
-
103
-
104
-
105
-
106
-
107
-
108
-
109
-
110
-
111
-
112
-
113
-
114
-
115
-
116
-
117
-
118
-
119
-
120
-
121
-
122
-
123
-
124
-
125
-
126
-
127
-
128
-
129
-
130
-
131
-
132
-
133
-
134
-
135
-
136
-
137
-
138
-
139
-
140
-
141
-
142
-
143
-
144
-
145
-
146
-
147
-
148
-
149
-
150
-
151
-
152
-
153
-
154
-
155
-
156
-
157
-
158
 |
 |

56
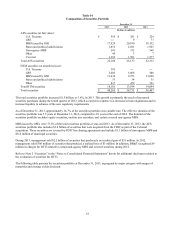
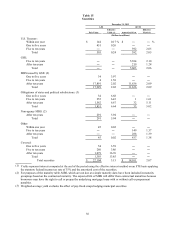
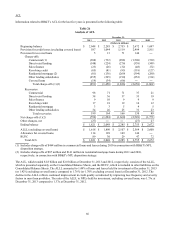
Table 15
Securities
December 31, 2013
AFS HTM
Effective Effective
Fair Value Yield (1) Amortized Cost Yield (1)
(Dollars in millions)
U.S. Treasury:
Within one year $ 144 0.17 % $ ― ― %
One to five years 451 0.26 ― ―
Five to ten years ― ― 392 2.05
Total 595 0.24 392 2.05
GSE:
Five to ten years ― ― 5,384 2.10
After ten years ― ― 219 1.28
Total ― ― 5,603 2.06
MBS issued by GSE: (2)
One to five years 34 3.97 ― ―
Five to ten years 4 1.58 ― ―
After ten years 17,891 2.02 11,636 2.09
Total 17,929 2.02 11,636 2.09
Obligations of states and political subdivisions: (3)
One to five years 34 6.68 ― ―
Five to ten years 255 6.43 1 1.61
After ten years 1,562 6.67 32 5.11
Total 1,851 6.64 33 5.02
N
on-agency MBS: (2)
After ten years 291 5.94 ― ―
Total 291 5.94 ― ―
Other:
Within one year 45 0.02 ― ―
Five to ten years ― ― 149 1.37
After ten years ― ― 288 1.39
Total 45 0.02 437 1.38
Covered:
One to five years 54 3.59 ― ―
Five to ten years 260 3.86 ― ―
After ten years 1,079 16.76 ― ―
Total 1,393 13.85 ― ―
Total securities $ 22,104 3.15 $ 18,101 2.07
(1) Yields represent interest computed at the end of the period using the effective interest method on an FTE basis applying
the statutory federal income tax rate of 35% and the amortized cost of the securities.
(2) For purposes of the maturity table, MBS, which are not due at a single maturity date, have been included in maturity
groupings based on the contractual maturity. The expected life of MBS will differ from contractual maturities because
borrowers may have the right to call or prepay the underlying mortgage loans with or without call or prepayment
penalties.
(3) Weighted-average yield excludes the effect of pay-fixed swaps hedging municipal securities.