BB&T 2013 Annual Report Download - page 86
Download and view the complete annual report
Please find page 86 of the 2013 BB&T annual report below. You can navigate through the pages in the report by either clicking on the pages listed below, or by using the keyword search tool below to find specific information within the annual report.-
 1
1 -
2
-
3
-
4
-
5
-
6
-
7
-
8
-
9
-
10
-
11
-
12
-
13
-
14
-
15
-
16
-
17
-
18
-
19
-
20
-
21
-
22
-
23
-
24
-
25
-
26
-
27
-
28
-
29
-
30
-
31
-
32
-
33
-
34
-
35
-
36
-
37
-
38
-
39
-
40
-
41
-
42
-
43
-
44
-
45
-
46
-
47
-
48
-
49
-
50
-
51
-
52
-
53
-
54
-
55
-
56
-
57
-
58
-
59
-
60
-
61
-
62
-
63
-
64
-
65
-
66
-
67
-
68
-
69
-
70
-
71
-
72
-
73
-
74
-
75
-
 76
76 -
 77
77 -
 78
78 -
 79
79 -
 80
80 -
 81
81 -
 82
82 -
 83
83 -
 84
84 -
 85
85 -
 86
86 -
 87
87 -
 88
88 -
 89
89 -
 90
90 -
 91
91 -
 92
92 -
 93
93 -
 94
94 -
 95
95 -
 96
96 -
97
-
98
-
99
-
100
-
101
-
102
-
103
-
104
-
105
-
106
-
107
-
108
-
109
-
110
-
111
-
112
-
113
-
114
-
115
-
116
-
117
-
118
-
119
-
120
-
121
-
122
-
123
-
124
-
125
-
126
-
127
-
128
-
129
-
130
-
131
-
132
-
133
-
134
-
135
-
136
-
137
-
138
-
139
-
140
-
141
-
142
-
143
-
144
-
145
-
146
-
147
-
148
-
149
-
150
-
151
-
152
-
153
-
154
-
155
-
156
-
157
-
158
 |
 |

The accompanying notes are an integral part of these consolidated financial statements.
86
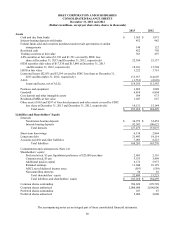
BB&T CORPORATION AND SUBSIDIARIES
CONSOLIDATED BALANCE SHEETS
December 31, 2013 and 2012
(Dollars in millions, except per share data, shares in thousands)
2013 2012
Assets
Cash and due from banks $ 1,565 $ 1,975
Interest-bearing deposits with banks 452 942
Federal funds sold and securities purchased under resale agreements or similar
arrangements 148 122
Restricted cash 422 750
Trading securities at fair value 381 497
AFS securities at fair value ($1,393 and $1,591 covered by FDIC loss
share at December 31, 2013 and December 31, 2012, respectively) 22,104 25,137
HTM securities (fair value of $17,530 and $13,848 at December 31, 2013
and December 31, 2012, respectively) 18,101 13,594
LHFS at fair value 1,222 3,761
Loans and leases ($2,035 and $3,294 covered by FDIC loss share at December 31,
2013 and December 31, 2012, respectively) 115,917 114,603
ALLL (1,732) (2,018)
Loans and leases, net of ALLL 114,185 112,585
Premises and equipment 1,869 1,888
Goodwill 6,814 6,804
Core deposit and other intangible assets 569 673
Residential MSRs at fair value 1,047 627
Other assets ($163 and $297 of foreclosed property and other assets covered by FDIC
loss share at December 31, 2013 and December 31, 2012, respectively) 14,131 15,144
Total assets $ 183,010 $ 184,499
Liabilities and Shareholders’ Equity
Deposits:
N
oninteres
t
-bearing deposits $ 34,972 $ 32,452
Interest-bearing deposits 92,503 100,623
Total deposits 127,475 133,075
Short-term borrowings 4,138 2,864
Long-term debt 21,493 19,114
Accounts payable and other liabilities 7,095 8,223
Total liabilities 160,201 163,276
Commitments and contingencies (Note 14)
Shareholders’ equity:
Preferred stock, $5 par, liquidation preference of $25,000 per share 2,603 2,116
Common stock, $5 par 3,533 3,499
Additional paid-in capital 6,172 5,973
Retained earnings 11,044 10,129
AOCI, net of deferred income taxes (593) (559)
N
oncontrolling interests 50 65
Total shareholders’ equity 22,809 21,223
Total liabilities and shareholders’ equity $ 183,010 $ 184,499
Common shares outstanding 706,620 699,728
Common shares authorized 2,000,000 2,000,000
Preferred shares outstanding 107 87
Preferred shares authorized 5,000 5,000