BB&T 2013 Annual Report Download - page 39
Download and view the complete annual report
Please find page 39 of the 2013 BB&T annual report below. You can navigate through the pages in the report by either clicking on the pages listed below, or by using the keyword search tool below to find specific information within the annual report.-
 1
1 -
2
-
3
-
4
-
5
-
6
-
7
-
8
-
9
-
10
-
11
-
12
-
13
-
14
-
15
-
16
-
17
-
18
-
19
-
20
-
21
-
22
-
23
-
24
-
25
-
26
-
27
-
28
-
 29
29 -
 30
30 -
 31
31 -
 32
32 -
 33
33 -
 34
34 -
 35
35 -
 36
36 -
 37
37 -
 38
38 -
 39
39 -
 40
40 -
 41
41 -
 42
42 -
 43
43 -
 44
44 -
 45
45 -
 46
46 -
 47
47 -
 48
48 -
 49
49 -
50
-
51
-
52
-
53
-
54
-
55
-
56
-
57
-
58
-
59
-
60
-
61
-
62
-
63
-
64
-
65
-
66
-
67
-
68
-
69
-
70
-
71
-
72
-
73
-
74
-
75
-
76
-
77
-
78
-
79
-
80
-
81
-
82
-
83
-
84
-
85
-
86
-
87
-
88
-
89
-
90
-
91
-
92
-
93
-
94
-
95
-
96
-
97
-
98
-
99
-
100
-
101
-
102
-
103
-
104
-
105
-
106
-
107
-
108
-
109
-
110
-
111
-
112
-
113
-
114
-
115
-
116
-
117
-
118
-
119
-
120
-
121
-
122
-
123
-
124
-
125
-
126
-
127
-
128
-
129
-
130
-
131
-
132
-
133
-
134
-
135
-
136
-
137
-
138
-
139
-
140
-
141
-
142
-
143
-
144
-
145
-
146
-
147
-
148
-
149
-
150
-
151
-
152
-
153
-
154
-
155
-
156
-
157
-
158
 |
 |

39
Income Taxes
The calculation of BB&T’s income tax provision is complex and requires the use of estimates and judgments. As part of the
Company’s analysis and implementation of business strategies, consideration is given to the tax laws and regulations that
apply to the specific facts and circumstances for any tax position under evaluation. For tax positions that are uncertain in
nature, management determines whether the tax position is more likely than not to be sustained upon examination. For tax
positions that meet this threshold, management then estimates the amount of the tax benefit to recognize in the financial
statements. Management closely monitors tax developments in order to evaluate the effect they may have on the Company’s
overall tax position and the estimates and judgments used in determining the income tax provision and records adjustments as
necessary.
A
nal
y
sis o
f
Results of Operations
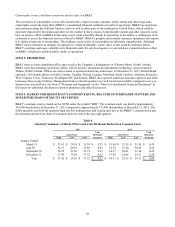
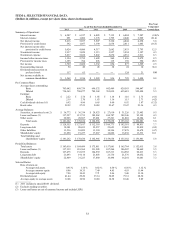
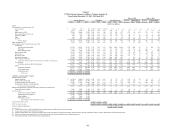
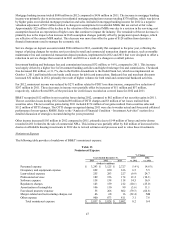
Table 7
Profitability Measures
Years Ended December 31,
2013 Adjusted 2013 (1) 2012 2011
EPS:
Basic $ 2.22 $ 2.96 $ 2.74 $ 1.85
Diluted 2.19 2.91 2.70 1.83
Rate of return on:
Average assets 0.95 % 1.24 % 1.14 % 0.82 %
Average common shareholders’ equity 8.06 10.55 10.35 7.49
N
IM (FTE) 3.68 N/A 3.91 4.06
(1) Calculated excluding the impact of the adjustments for uncertain income tax positions of $516 million recorded
during 2013. For additional information, see Non-GAAP Information on page 83.
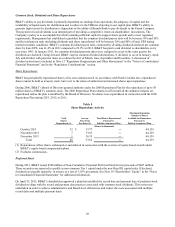
Net Interest Income and NIM
Net interest income is BB&T’s primary source of revenue. Net interest income is influenced by a number of factors,
including the volume, mix and maturity of interest-earning assets and interest-bearing liabilities and the interest rates earned
and paid thereon. The difference between rates earned on interest-earning assets and the cost of funds (with a FTE adjustment
made to tax-exempt items to provide comparability with taxable items) is measured by the NIM.
2013 compared to 2012
For 2013, net interest income on an FTE-adjusted basis totaled $5.8 billion, a decrease of $244 million or 4.1%, compared to
the prior year. The decrease in net interest income reflects lower yields on new loans and securities and runoff in the covered
loan portfolio, partially offset by lower funding costs, which declined $170 million compared to 2012. The improvement in
funding costs reflects an 11 basis point reduction in the average cost of interest-bearing deposits and a lower average long-
term debt balance.
The FTE-adjusted NIM is the primary measure used in evaluating the gross profit margin from the portfolios of earning
assets. The FTE-adjusted NIM was 3.68% in 2013 compared with 3.91% in 2012. The decline in the NIM primarily reflects
lower yields on new loans and securities and covered loan runoff, partially offset by the lower funding costs described above.
The average annualized FTE yield for total loans and leases was 4.85% for 2013, compared to 5.35% for the prior year. The
decrease was primarily due to lower yields on new loan originations and the runoff of higher yielding covered loans. The
FTE yield on the total securities portfolio was 2.51% for the year ended December 31, 2013, compared to 2.64% for the prior
year. This decrease reflects runoff in the covered security portfolio and security duration adjustments.
Management expects NIM to decline approximately five basis points in the first quarter of 2014 as a result of an increase in
the relative size of the securities portfolio and lower earning asset yields, partially offset by lower funding costs.
The average rate paid on interest-bearing deposits dropped to 0.32% during 2013, from 0.43% in 2012. This improvement
included a 16 basis point reduction in the cost of certificates and other time deposits and a five basis point reduction in the
cost of money market and savings accounts.