BB&T 2013 Annual Report Download - page 131
Download and view the complete annual report
Please find page 131 of the 2013 BB&T annual report below. You can navigate through the pages in the report by either clicking on the pages listed below, or by using the keyword search tool below to find specific information within the annual report.-
 1
1 -
2
-
3
-
4
-
5
-
6
-
7
-
8
-
9
-
10
-
11
-
12
-
13
-
14
-
15
-
16
-
17
-
18
-
19
-
20
-
21
-
22
-
23
-
24
-
25
-
26
-
27
-
28
-
29
-
30
-
31
-
32
-
33
-
34
-
35
-
36
-
37
-
38
-
39
-
40
-
41
-
42
-
43
-
44
-
45
-
46
-
47
-
48
-
49
-
50
-
51
-
52
-
53
-
54
-
55
-
56
-
57
-
58
-
59
-
60
-
61
-
62
-
63
-
64
-
65
-
66
-
67
-
68
-
69
-
70
-
71
-
72
-
73
-
74
-
75
-
76
-
77
-
78
-
79
-
80
-
81
-
82
-
83
-
84
-
85
-
86
-
87
-
88
-
89
-
90
-
91
-
92
-
93
-
94
-
95
-
96
-
97
-
98
-
99
-
100
-
101
-
102
-
103
-
104
-
105
-
106
-
107
-
108
-
109
-
110
-
111
-
112
-
113
-
114
-
115
-
116
-
117
-
118
-
119
-
120
-
 121
121 -
 122
122 -
 123
123 -
 124
124 -
 125
125 -
 126
126 -
 127
127 -
 128
128 -
 129
129 -
 130
130 -
 131
131 -
 132
132 -
 133
133 -
 134
134 -
 135
135 -
 136
136 -
 137
137 -
 138
138 -
 139
139 -
 140
140 -
 141
141 -
142
-
143
-
144
-
145
-
146
-
147
-
148
-
149
-
150
-
151
-
152
-
153
-
154
-
155
-
156
-
157
-
158
 |
 |

131
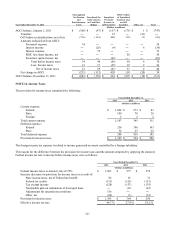
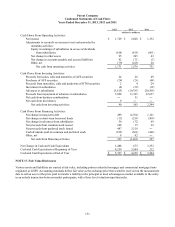
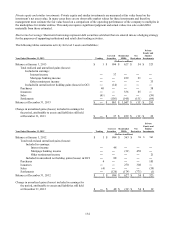
Parent Company
Condensed Statements of Cash Flows
Years Ended December 31, 2013, 2012 and 2011
.
2013 2012 2011
(Dollars in millions)
Cash Flows From Operating Activities:
N
et income $ 1,729 $ 2,028 $ 1,332
Adjustments to reconcile net income to net cash provided by
operating activities:
Equity in earnings of subsidiaries in excess of dividends
from subsidiaries (616) (418) (661)
N
et change in other assets 95 265 63
N
et change in accounts payable and accrued liabilities 42 (71) (3)
Other, net (79) (228) 20
N
et cash from operating activities 1,171 1,576 751
Cash Flows From Investing Activities:
Proceeds from sales, calls and maturities of AFS securities 24 26 49
Purchases of AFS securities (24) (26) (48)
Proceeds from maturities, calls and paydowns of HTM securities 2 4 24
Investment in subsidiaries (4) (30) (12)
Advances to subsidiaries (5,815) (10,785) (20,306)
Proceeds from repayment of advances to subsidiaries 5,898 11,325 22,637
N
et cash from business combinations ― 51 ―
N
et cash from divestitures 9 ― ―
N
et cash from investing activities 90 565 2,344
Cash Flows From Financing Activities:
N
et change in long-term debt 499 (2,764) 1,121
N
et change in shor
t
-term borrowed funds (13) (259) (509)
N
et change in advances from subsidiaries 50 (72) 69
N
et proceeds from common stock issue
d
108 15 22
N
et proceeds from preferred stock issue
d
487 2,116 ―
Cash dividends paid on common and preferred stock (912) (564) (446)
Other, net 8 62 ―
N
et cash from financing activities 227 (1,466) 257
N
et Change in Cash and Cash Equivalents 1,488 675 3,352
Cash and Cash Equivalents at Beginning of Year 4,239 3,564 212
Cash and Cash Equivalents at End of Year $ 5,727 $ 4,239 $ 3,564
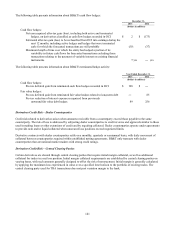
NOTE 17. Fair Value Disclosures
Various assets and liabilities are carried at fair value, including prime residential mortgage and commercial mortgage loans
originated as LHFS. Accounting standards define fair value as the exchange price that would be received on the measurement
date to sell an asset or the price paid to transfer a liability in the principal or most advantageous market available to the entity
in an orderly transaction between market participants, with a three level valuation input hierarchy.