BB&T 2013 Annual Report Download - page 69
Download and view the complete annual report
Please find page 69 of the 2013 BB&T annual report below. You can navigate through the pages in the report by either clicking on the pages listed below, or by using the keyword search tool below to find specific information within the annual report.-
 1
1 -
2
-
3
-
4
-
5
-
6
-
7
-
8
-
9
-
10
-
11
-
12
-
13
-
14
-
15
-
16
-
17
-
18
-
19
-
20
-
21
-
22
-
23
-
24
-
25
-
26
-
27
-
28
-
29
-
30
-
31
-
32
-
33
-
34
-
35
-
36
-
37
-
38
-
39
-
40
-
41
-
42
-
43
-
44
-
45
-
46
-
47
-
48
-
49
-
50
-
51
-
52
-
53
-
54
-
55
-
56
-
57
-
58
-
 59
59 -
 60
60 -
 61
61 -
 62
62 -
 63
63 -
 64
64 -
 65
65 -
 66
66 -
 67
67 -
 68
68 -
 69
69 -
 70
70 -
 71
71 -
 72
72 -
 73
73 -
 74
74 -
 75
75 -
 76
76 -
 77
77 -
 78
78 -
 79
79 -
80
-
81
-
82
-
83
-
84
-
85
-
86
-
87
-
88
-
89
-
90
-
91
-
92
-
93
-
94
-
95
-
96
-
97
-
98
-
99
-
100
-
101
-
102
-
103
-
104
-
105
-
106
-
107
-
108
-
109
-
110
-
111
-
112
-
113
-
114
-
115
-
116
-
117
-
118
-
119
-
120
-
121
-
122
-
123
-
124
-
125
-
126
-
127
-
128
-
129
-
130
-
131
-
132
-
133
-
134
-
135
-
136
-
137
-
138
-
139
-
140
-
141
-
142
-
143
-
144
-
145
-
146
-
147
-
148
-
149
-
150
-
151
-
152
-
153
-
154
-
155
-
156
-
157
-
158
 |
 |

69
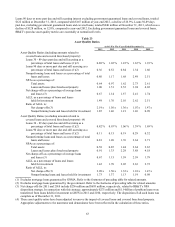
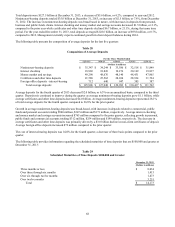
Short-term Borrowings
BB&T also uses various types of short-term borrowings in meeting funding needs. While deposits remain the primary source
for funding loan originations, management uses short-term borrowings as a supplementary funding source for loan growth
and other balance sheet management purposes. Short-term borrowings were 2.5% of total funding on average in 2013 as
compared to 1.9% in 2012. See Note 7 “Short-Term Borrowings” in the “Notes to Consolidated Financial Statements” herein
for further disclosure. The types of short-term borrowings that have been, or may be, used by the Company include Federal
funds purchased, securities sold under repurchase agreements, master notes, commercial paper and short-term bank notes. All
securities sold under repurchase agreements are reflected as collateralized borrowings on the balance sheet. Short-term
borrowings at the end of 2013 were $4.1 billion, an increase of $1.3 billion, or 44.5%, compared to year-end 2012. Average
short-term borrowings totaled $4.5 billion during 2013 compared to $3.4 billion last year, an increase of 30.8%. The increase
in the average balance during 2013 primarily reflects the managed reduction in non-client certificates of deposit.
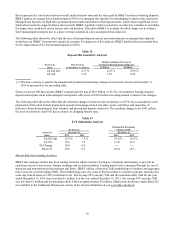
The following table summarizes certain information for the past three years with respect to short-term borrowings:
Table 30
Short-Term Borrowings
As Of / For The Years Ended December 31,
2013 2012 2011
(Dollars in millions)
Securities Sold Under Agreements to Repurchase:
Maximum outstanding at any month-end during the year $ 1,537 $ 813 $ 1,176
Balance outstanding at end of year 463 514 619
Average outstanding during the year 662 651 956
Average interest rate during the year 0.25 % 0.30 % 0.73 %
Average interest rate at end of year 0.28 0.33 0.31
Federal Funds Purchased and Short-Term Borrowed Funds:
Maximum outstanding at any month-end during the year $ 4,722 $ 3,627 $ 9,350
Balance outstanding at end of year 3,675 2,350 2,947
Average outstanding during the year 3,797 2,757 4,233
Average interest rate during the year 0.13 % 0.20 % 0.10 %
Average interest rate at end of year 0.09 0.19 0.17
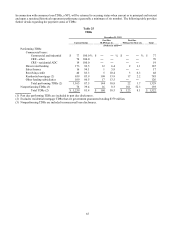
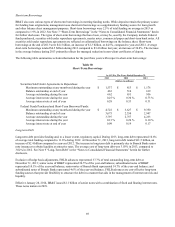
Long-term Debt
Long-term debt provides funding and, to a lesser extent, regulatory capital. During 2013, long-term debt represented 10.6%
of average total funding compared to 11.6% during 2012. At December 31, 2013, long-term debt totaled $21.5 billion, an
increase of $2.4 billion compared to year-end 2012. The increase in long-term debt is primarily due to Branch Bank senior
note issuances to obtain liquidity at attractive rates. The average cost of long-term debt was 3.03% in 2013, compared to
3.02% in 2012. See Note 9 “Long-Term Debt” in the “Notes to Consolidated Financial Statements” herein for further
disclosure.
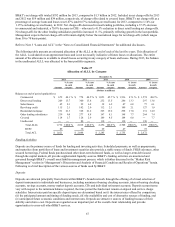
Exclusive of hedge basis adjustments, FHLB advances represented 37.7% of total outstanding long-term debt at
December 31, 2013; senior notes of BB&T represented 30.5% of the year-end balance; subordinated notes of BB&T
represented 10.1% of the year-end balance; senior notes of Branch Bank represented 14.7% of the year-end balance; and
subordinated notes of Branch Bank represented 4.6% of the year-end balance. FHLB advances are cost-effective long-term
funding sources that provide flexibility to structure the debt in a manner that aids in the management of interest rate risk and
liquidity.
Effective January 28, 2014, BB&T issued $1.1 billion of senior notes with a combination of fixed and floating interest rates.
These notes mature in 2019.