BB&T 2013 Annual Report Download - page 55
Download and view the complete annual report
Please find page 55 of the 2013 BB&T annual report below. You can navigate through the pages in the report by either clicking on the pages listed below, or by using the keyword search tool below to find specific information within the annual report.-
 1
1 -
2
-
3
-
4
-
5
-
6
-
7
-
8
-
9
-
10
-
11
-
12
-
13
-
14
-
15
-
16
-
17
-
18
-
19
-
20
-
21
-
22
-
23
-
24
-
25
-
26
-
27
-
28
-
29
-
30
-
31
-
32
-
33
-
34
-
35
-
36
-
37
-
38
-
39
-
40
-
41
-
42
-
43
-
44
-
 45
45 -
 46
46 -
 47
47 -
 48
48 -
 49
49 -
 50
50 -
 51
51 -
 52
52 -
 53
53 -
 54
54 -
 55
55 -
 56
56 -
 57
57 -
 58
58 -
 59
59 -
 60
60 -
 61
61 -
 62
62 -
 63
63 -
 64
64 -
 65
65 -
66
-
67
-
68
-
69
-
70
-
71
-
72
-
73
-
74
-
75
-
76
-
77
-
78
-
79
-
80
-
81
-
82
-
83
-
84
-
85
-
86
-
87
-
88
-
89
-
90
-
91
-
92
-
93
-
94
-
95
-
96
-
97
-
98
-
99
-
100
-
101
-
102
-
103
-
104
-
105
-
106
-
107
-
108
-
109
-
110
-
111
-
112
-
113
-
114
-
115
-
116
-
117
-
118
-
119
-
120
-
121
-
122
-
123
-
124
-
125
-
126
-
127
-
128
-
129
-
130
-
131
-
132
-
133
-
134
-
135
-
136
-
137
-
138
-
139
-
140
-
141
-
142
-
143
-
144
-
145
-
146
-
147
-
148
-
149
-
150
-
151
-
152
-
153
-
154
-
155
-
156
-
157
-
158
 |
 |

55
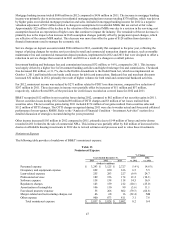
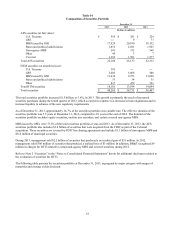
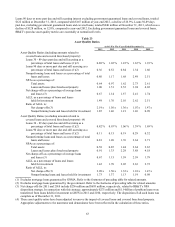
Table 14
Composition of Securities Portfolio
December 31,
2013 2012 2011
(Dollars in millions)
AFS securities (at fair value):
U.S. Treasury $ 595 $ 281 $ 229
GSE ― 9 77
MBS issued by GSE 17,929 20,930 18,132
States and political subdivisions 1,851 2,011 1,923
N
on-agency MBS 291 312 368
Other 45 3 7
Covered 1,393 1,591 1,577
Total AFS securities 22,104 25,137 22,313
HTM securities (at amortized cost):
U.S. Treasury 392 ― ―
GSE 5,603 3,808 500
MBS issued by GSE 11,636 9,273 13,028
States and political subdivisions 33 34 35
Other 437 479 531
Total HTM securities 18,101 13,594 14,094
Total securities $ 40,205 $ 38,731 $ 36,407
The total securities portfolio increased $1.5 billion, or 3.8%, in 2013. This growth is primarily the result of increased
securities purchases during the fourth quarter of 2013, which occurred in response to a decrease in loan originations and to
increase liquidity in advance of the new regulatory requirements.
As of December 31, 2013, approximately 14.7% of the securities portfolio was variable rate. The effective duration of the
securities portfolio was 5.5 years at December 31, 2013, compared to 2.8 years at the end of 2012. The duration of the
securities portfolio excludes equity securities, auction rate securities, and certain covered non-agency MBS.
MBS issued by GSEs were 73.5% of the total securities portfolio at year-end 2013. As of December 31, 2013, the AFS
securities portfolio also includes $1.4 billion of securities that were acquired from the FDIC as part of the Colonial
acquisition. These securities are covered by FDIC loss sharing agreements and include $1.1 billion of non-agency MBS and
$314 million of municipal securities.
During 2013, management sold $2.2 billion of securities that produced a net realized gain of $51 million. In 2012,
management sold $306 million of securities that produced a realized loss of $3 million. In addition, BB&T recognized $9
million in charges for OTTI related to certain non-agency MBS and covered securities during 2012.
Refer to Note 2 “Securities” in the “Notes to Consolidated Financial Statements” herein for additional disclosures related to
the evaluation of securities for OTTI.
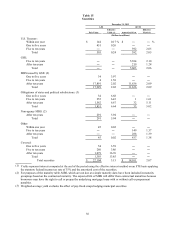
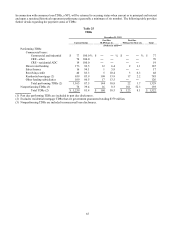
The following table presents the securities portfolio at December 31, 2013, segregated by major category with ranges of
maturities and average yields disclosed: