BB&T 2013 Annual Report Download - page 75
Download and view the complete annual report
Please find page 75 of the 2013 BB&T annual report below. You can navigate through the pages in the report by either clicking on the pages listed below, or by using the keyword search tool below to find specific information within the annual report.-
 1
1 -
2
-
3
-
4
-
5
-
6
-
7
-
8
-
9
-
10
-
11
-
12
-
13
-
14
-
15
-
16
-
17
-
18
-
19
-
20
-
21
-
22
-
23
-
24
-
25
-
26
-
27
-
28
-
29
-
30
-
31
-
32
-
33
-
34
-
35
-
36
-
37
-
38
-
39
-
40
-
41
-
42
-
43
-
44
-
45
-
46
-
47
-
48
-
49
-
50
-
51
-
52
-
53
-
54
-
55
-
56
-
57
-
58
-
59
-
60
-
61
-
62
-
63
-
64
-
 65
65 -
 66
66 -
 67
67 -
 68
68 -
 69
69 -
 70
70 -
 71
71 -
 72
72 -
 73
73 -
 74
74 -
 75
75 -
 76
76 -
 77
77 -
 78
78 -
 79
79 -
 80
80 -
 81
81 -
 82
82 -
 83
83 -
 84
84 -
 85
85 -
86
-
87
-
88
-
89
-
90
-
91
-
92
-
93
-
94
-
95
-
96
-
97
-
98
-
99
-
100
-
101
-
102
-
103
-
104
-
105
-
106
-
107
-
108
-
109
-
110
-
111
-
112
-
113
-
114
-
115
-
116
-
117
-
118
-
119
-
120
-
121
-
122
-
123
-
124
-
125
-
126
-
127
-
128
-
129
-
130
-
131
-
132
-
133
-
134
-
135
-
136
-
137
-
138
-
139
-
140
-
141
-
142
-
143
-
144
-
145
-
146
-
147
-
148
-
149
-
150
-
151
-
152
-
153
-
154
-
155
-
156
-
157
-
158
 |
 |

75
The asset/liability management process requires a number of key assumptions. Management determines the most likely
outlook for the economy and interest rates by analyzing external factors, including published economic projections and data,
the effects of likely monetary and fiscal policies, as well as any enacted or prospective regulatory changes. BB&T’s current
and prospective liquidity position, current balance sheet volumes and projected growth, accessibility of funds for short-term
needs and capital maintenance are also considered. This data is combined with various interest rate scenarios to provide
management with the information necessary to analyze interest sensitivity and to aid in the development of strategies to reach
performance goals.
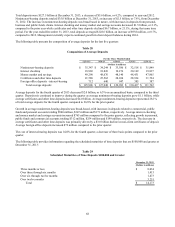
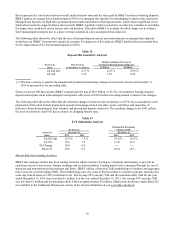
The following table shows the effect that the indicated changes in interest rates would have on net interest income as
projected for the next twelve months assuming a gradual change in interest rates as described below. Key assumptions in the
preparation of the table include prepayment speeds of mortgage-related and other assets, cash flows and maturities of
derivative financial instruments, loan volumes and pricing, deposit sensitivity, customer preferences and capital plans. The
resulting change in net interest income reflects the level of sensitivity that interest sensitive income has in relation to
changing interest rates.
Table 31
Interest Sensitivity Simulation Analysis
Interest Rate Scenario Annualized Hypothetical Percentage
Linear Prime Rate Change in Net Interest Income
Change in December 31, December 31,
Prime Rate 2013 2012 2013 2012
Up 200 bps 5.25 % 5.25 % 2.27 % 3.16 %
Up 100 4.25 4.25 1.35 2.04
No Change 3.25 3.25 ― ―
Down 25 3.00 3.00 0.39 (0.13)
The MRLCC has established parameters related to interest sensitivity that prescribe a maximum negative impact on net
interest income under different interest rate scenarios. In the event the results of the Simulation model fall outside the
established parameters, management will make recommendations to the MRLCC on the most appropriate response given the
current economic forecast. The following parameters and interest rate scenarios are considered BB&T’s primary measures of
interest rate risk:
Maximum negative impact on net interest income of 2% for the next 12 months assuming a linear change
in interest rates totaling 100 basis points over four months followed by a flat interest rate scenario for the
remaining eight month period.
Maximum negative impact on net interest income of 4% for the next 12 months assuming a linear change
of 200 basis points over eight months followed by a flat interest rate scenario for the remaining four month
period.
If a rate change of 200 basis points cannot be modeled due to a low level of rates, a proportional limit applies. Management
currently only models a negative 25 basis point decline because larger declines would have resulted in a Federal funds rate of
less than zero. In a situation such as this, the maximum negative impact on net interest income is adjusted on a proportional
basis. Regardless of the proportional limit, the negative risk exposure limit will be the greater of 1% or the proportional limit.
Management has also established a maximum negative impact on net interest income of 4% for an immediate 100 basis
points change in rates and 8% for an immediate 200 basis points change in rates. These “interest rate shock” limits are
designed to create an outer band of acceptable risk based upon a significant and immediate change in rates.
Management must also consider how the balance sheet and interest rate risk position could be impacted by changes in
balance sheet mix. Liquidity in the banking industry has been very strong during the current economic cycle. Much of this
liquidity increase has been due to a significant increase in noninterest-bearing demand deposits. Consistent with the industry,
Branch Bank has seen a significant increase in this funding source. The behavior of these deposits is one of the most
important assumptions used in determining the interest rate risk position of BB&T. A loss of these deposits in the future
would reduce the asset sensitivity of BB&T’s balance sheet as the company increases interest-bearing funds to offset the loss
of this advantageous funding source.