BB&T 2013 Annual Report Download - page 61
Download and view the complete annual report
Please find page 61 of the 2013 BB&T annual report below. You can navigate through the pages in the report by either clicking on the pages listed below, or by using the keyword search tool below to find specific information within the annual report.-
 1
1 -
2
-
3
-
4
-
5
-
6
-
7
-
8
-
9
-
10
-
11
-
12
-
13
-
14
-
15
-
16
-
17
-
18
-
19
-
20
-
21
-
22
-
23
-
24
-
25
-
26
-
27
-
28
-
29
-
30
-
31
-
32
-
33
-
34
-
35
-
36
-
37
-
38
-
39
-
40
-
41
-
42
-
43
-
44
-
45
-
46
-
47
-
48
-
49
-
50
-
 51
51 -
 52
52 -
 53
53 -
 54
54 -
 55
55 -
 56
56 -
 57
57 -
 58
58 -
 59
59 -
 60
60 -
 61
61 -
 62
62 -
 63
63 -
 64
64 -
 65
65 -
 66
66 -
 67
67 -
 68
68 -
 69
69 -
 70
70 -
 71
71 -
72
-
73
-
74
-
75
-
76
-
77
-
78
-
79
-
80
-
81
-
82
-
83
-
84
-
85
-
86
-
87
-
88
-
89
-
90
-
91
-
92
-
93
-
94
-
95
-
96
-
97
-
98
-
99
-
100
-
101
-
102
-
103
-
104
-
105
-
106
-
107
-
108
-
109
-
110
-
111
-
112
-
113
-
114
-
115
-
116
-
117
-
118
-
119
-
120
-
121
-
122
-
123
-
124
-
125
-
126
-
127
-
128
-
129
-
130
-
131
-
132
-
133
-
134
-
135
-
136
-
137
-
138
-
139
-
140
-
141
-
142
-
143
-
144
-
145
-
146
-
147
-
148
-
149
-
150
-
151
-
152
-
153
-
154
-
155
-
156
-
157
-
158
 |
 |

61
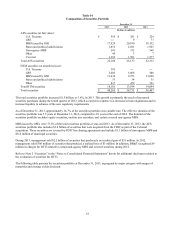
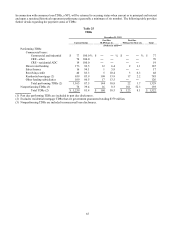
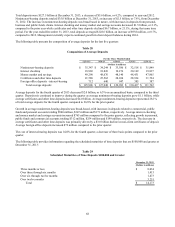
The following table presents the changes in NPAs during 2013 and 2012:
Table 21
Rollforward of NPAs
Years Ended December 31,
2013 2012
(Dollars in millions)
Balance at beginning of year $ 1,536 $ 2,450
N
ew NPAs 1,583 2,449
Advances and principal increases 177 161
Disposals of foreclosed assets (533) (737)
Disposals of NPLs (1) (348) (754)
Charge-offs and losses (511) (1,002)
Payments (636) (669)
Transfers to performing status (212) (392)
Other, net (3) 30
Balance at end of year $ 1,053 $ 1,536
(1) Includes charge-offs and losses recorded upon sale of $73 million and $219 million for the years ended December 31,
2013 and 2012, respectively.
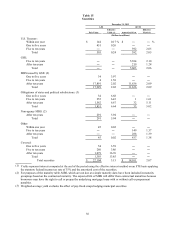
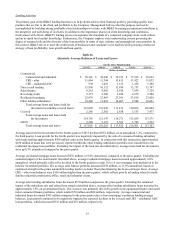
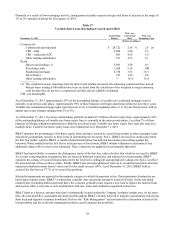
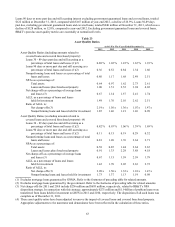
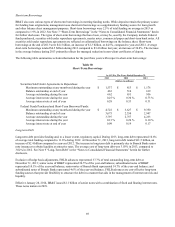
The following tables summarize asset quality information for the past five years. As more fully described below, this
information has been adjusted to exclude past due loans that are subject to FDIC loss sharing agreements and certain
mortgage loans guaranteed by the government:
In accordance with regulatory reporting standards, covered loans that are contractually past due are
reported as past due and still accruing based on the number of days past due. However, given the
significant amount of acquired loans that are past due but still accruing due to the application of the
expected cash flows method, BB&T has concluded that it is appropriate to adjust Table 22 to exclude
covered loans in summarizing total loans 90 days or more past due and still accruing and total loans 30-89
days past due and still accruing.
BB&T has also concluded that the inclusion of covered loans in certain asset quality ratios summarized in
Table 23 including “Loans 30-89 days past due and still accruing as a percentage of total loans and leases,”
“Loans 90 days or more past due and still accruing as a percentage of total loans and leases,”
“Nonperforming loans and leases as a percentage of total loans and leases” and certain other asset quality
ratios that reflect NPAs in the numerator or denominator (or both) results in significant distortion to these
ratios. In addition, because loan level charge-offs related to the acquired loans are not recognized in the
financial statements until the cumulative amounts exceed the original loss projections on a pool basis, the
net charge-off ratio for the acquired loans is not consistent with the net charge-off ratio for other loan
portfolios. The inclusion of these loans in the asset quality ratios described above could result in a lack of
comparability across quarters or years, and could negatively impact comparability with other portfolios that
were not impacted by acquisition accounting. BB&T believes that the presentation of asset quality
measures excluding covered loans and related amounts from both the numerator and denominator provides
better perspective into underlying trends related to the quality of its loan portfolio. Accordingly, the asset
quality measures in Table 23 present asset quality information both on a consolidated basis as well as
excluding the covered assets and related amounts.
In addition, BB&T has excluded mortgage loans that are guaranteed by the government, primarily
FHA/VA loans, from the asset quality metrics and ratios reflected on Tables 22 and 23, as these loans are
recoverable through various government guarantees. In addition, BB&T has recorded on the balance sheet
certain amounts related to delinquent GNMA loans serviced for others that BB&T has the option, but not
the obligation, to repurchase and has effectively regained control. These amounts are also excluded from
asset quality metrics as reimbursement of insured amounts is proceeding in accordance with investor
guidelines. The amount of government guaranteed mortgage loans and GNMA loans serviced for others
that have been excluded are noted in the footnotes to Table 22.