BB&T 2013 Annual Report Download - page 134
Download and view the complete annual report
Please find page 134 of the 2013 BB&T annual report below. You can navigate through the pages in the report by either clicking on the pages listed below, or by using the keyword search tool below to find specific information within the annual report.-
 1
1 -
2
-
3
-
4
-
5
-
6
-
7
-
8
-
9
-
10
-
11
-
12
-
13
-
14
-
15
-
16
-
17
-
18
-
19
-
20
-
21
-
22
-
23
-
24
-
25
-
26
-
27
-
28
-
29
-
30
-
31
-
32
-
33
-
34
-
35
-
36
-
37
-
38
-
39
-
40
-
41
-
42
-
43
-
44
-
45
-
46
-
47
-
48
-
49
-
50
-
51
-
52
-
53
-
54
-
55
-
56
-
57
-
58
-
59
-
60
-
61
-
62
-
63
-
64
-
65
-
66
-
67
-
68
-
69
-
70
-
71
-
72
-
73
-
74
-
75
-
76
-
77
-
78
-
79
-
80
-
81
-
82
-
83
-
84
-
85
-
86
-
87
-
88
-
89
-
90
-
91
-
92
-
93
-
94
-
95
-
96
-
97
-
98
-
99
-
100
-
101
-
102
-
103
-
104
-
105
-
106
-
107
-
108
-
109
-
110
-
111
-
112
-
113
-
114
-
115
-
116
-
117
-
118
-
119
-
120
-
121
-
122
-
123
-
 124
124 -
 125
125 -
 126
126 -
 127
127 -
 128
128 -
 129
129 -
 130
130 -
 131
131 -
 132
132 -
 133
133 -
 134
134 -
 135
135 -
 136
136 -
 137
137 -
 138
138 -
 139
139 -
 140
140 -
 141
141 -
 142
142 -
 143
143 -
 144
144 -
145
-
146
-
147
-
148
-
149
-
150
-
151
-
152
-
153
-
154
-
155
-
156
-
157
-
158
 |
 |

134
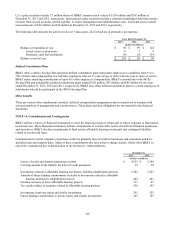
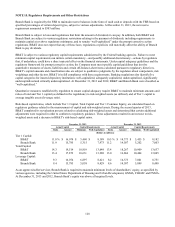
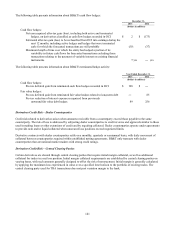
Private equity and similar investments: Private equity and similar investments are measured at fair value based on the
investment’s net asset value. In many cases there are no observable market values for these investments and therefore
management must estimate the fair value based on a comparison of the operating performance of the company to multiples in
the marketplace for similar entities. This analysis requires significant judgment and actual values in a sale could differ
materially from those estimated.
Short-term borrowings: Short-term borrowings represent debt securities sold short that are entered into as a hedging strategy
for the purposes of supporting institutional and retail client trading activities.
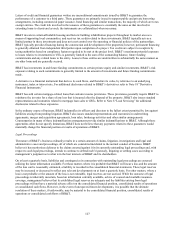
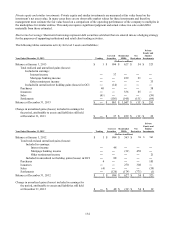
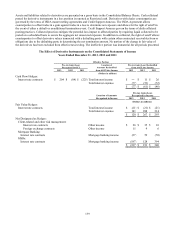
The following tables summarize activity for level 3 assets and liabilities:
Private
Equity and
Covered Residential Net Similar
Year Ended December 31, 2013 Trading Securities MSRs Derivatives Investments
(Dollars in millions)
Balance at January 1, 2013 $ 1 $ 994 $ 627 $ 54 $ 323
Total realized and unrealized gains (losses):
Included in earnings:
Interest income ― 37 ― ― ―
Mortgage banking income ― ― 229 21 ―
Other noninterest income ― ― ― ― 33
Included in unrealized net holding gains (losses) in OCI ― (14) ― ― ―
Purchases 40 ― ― ― 58
Issuances ― ― 336 65 ―
Sales (41) ― ― ― (59)
Settlements ― (156) (145) (151) (64)
Balance at December 31, 2013 $ ― $ 861 $ 1,047 $ (11) $ 291
Change in unrealized gains (losses) included in earnings for
the period, attributable to assets and liabilities still held
at December 31, 2013 $ ― $ 37 $ 229 $ (11) $ 22
Private
Equity and
Covered Residential Net Similar
Year Ended December 31, 2012 Trading Securities MSRs Derivatives Investments
(Dollars in millions)
Balance at January 1, 2012 $ 1 $ 984 $ 563 $ 59 $ 261
Total realized and unrealized gains (losses):
Included in earnings:
Interest income ― 48 ― ― ―
Mortgage banking income ― ― (32) 458 ―
Other noninterest income ― ― ― ― 21
Included in unrealized net holding gains (losses) in OCI ― 88 ― ― ―
Purchases 4 ― ― ― 101
Issuances ― ― 270 308 ―
Sales (4) ― ― ― (59)
Settlements ― (126) (174) (771) (1)
Balance at December 31, 2012 $ 1 $ 994 $ 627 $ 54 $ 323
Change in unrealized gains (losses) included in earnings for
the period, attributable to assets and liabilities still held
at December 31, 2012 $ ― $ 48 $ (32) $ 54 $ 12