BB&T 2013 Annual Report Download - page 32
Download and view the complete annual report
Please find page 32 of the 2013 BB&T annual report below. You can navigate through the pages in the report by either clicking on the pages listed below, or by using the keyword search tool below to find specific information within the annual report.-
 1
1 -
2
-
3
-
4
-
5
-
6
-
7
-
8
-
9
-
10
-
11
-
12
-
13
-
14
-
15
-
16
-
17
-
18
-
19
-
20
-
21
-
 22
22 -
 23
23 -
 24
24 -
 25
25 -
 26
26 -
 27
27 -
 28
28 -
 29
29 -
 30
30 -
 31
31 -
 32
32 -
 33
33 -
 34
34 -
 35
35 -
 36
36 -
 37
37 -
 38
38 -
 39
39 -
 40
40 -
 41
41 -
 42
42 -
43
-
44
-
45
-
46
-
47
-
48
-
49
-
50
-
51
-
52
-
53
-
54
-
55
-
56
-
57
-
58
-
59
-
60
-
61
-
62
-
63
-
64
-
65
-
66
-
67
-
68
-
69
-
70
-
71
-
72
-
73
-
74
-
75
-
76
-
77
-
78
-
79
-
80
-
81
-
82
-
83
-
84
-
85
-
86
-
87
-
88
-
89
-
90
-
91
-
92
-
93
-
94
-
95
-
96
-
97
-
98
-
99
-
100
-
101
-
102
-
103
-
104
-
105
-
106
-
107
-
108
-
109
-
110
-
111
-
112
-
113
-
114
-
115
-
116
-
117
-
118
-
119
-
120
-
121
-
122
-
123
-
124
-
125
-
126
-
127
-
128
-
129
-
130
-
131
-
132
-
133
-
134
-
135
-
136
-
137
-
138
-
139
-
140
-
141
-
142
-
143
-
144
-
145
-
146
-
147
-
148
-
149
-
150
-
151
-
152
-
153
-
154
-
155
-
156
-
157
-
158
 |
 |

32
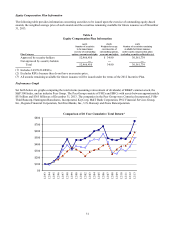
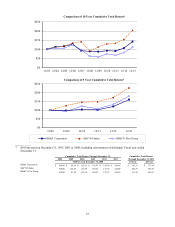
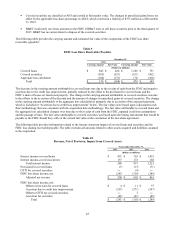
* $100 invested on December 31, 1993, 2003 or 2008, including reinvestment of dividends. Fiscal year ended
December 31.
Cumulative Total Return Through December 31, Cumulative Total Return
2008 2009 2010 2011 2012 2013 Through December 31, 2013
$100 Invested December 31, 2008 10 Year 20 Year
BB&T Corporation $ 100.00 $ 98.10 $ 103.92 $ 101.97 $ 120.90 $ 160.46 $ 142.21 $ 753.64
S&P 500 Index 100.00 126.45 145.49 148.55 172.30 228.09 204.29 582.47
BB&T’s Peer Group 100.00 93.38 122.34 108.47 132.74 180.14 111.24 495.97
$0
$50
$100
$150
$200
$250
12/03 12/04 12/05 12/06 12/07 12/08 12/09 12/10 12/11 12/12 12/13
Comparison of 10 Year Cumulative Total Return*
$0
$50
$100
$150
$200
$250
12/08 12/09 12/10 12/11 12/12 12/13
Comparison of 5 Year Cumulative Total Return*
BB&T Corporation S&P 500 Index BB&T's Peer Group