BB&T 2013 Annual Report Download - page 119
Download and view the complete annual report
Please find page 119 of the 2013 BB&T annual report below. You can navigate through the pages in the report by either clicking on the pages listed below, or by using the keyword search tool below to find specific information within the annual report.-
 1
1 -
2
-
3
-
4
-
5
-
6
-
7
-
8
-
9
-
10
-
11
-
12
-
13
-
14
-
15
-
16
-
17
-
18
-
19
-
20
-
21
-
22
-
23
-
24
-
25
-
26
-
27
-
28
-
29
-
30
-
31
-
32
-
33
-
34
-
35
-
36
-
37
-
38
-
39
-
40
-
41
-
42
-
43
-
44
-
45
-
46
-
47
-
48
-
49
-
50
-
51
-
52
-
53
-
54
-
55
-
56
-
57
-
58
-
59
-
60
-
61
-
62
-
63
-
64
-
65
-
66
-
67
-
68
-
69
-
70
-
71
-
72
-
73
-
74
-
75
-
76
-
77
-
78
-
79
-
80
-
81
-
82
-
83
-
84
-
85
-
86
-
87
-
88
-
89
-
90
-
91
-
92
-
93
-
94
-
95
-
96
-
97
-
98
-
99
-
100
-
101
-
102
-
103
-
104
-
105
-
106
-
107
-
108
-
 109
109 -
 110
110 -
 111
111 -
 112
112 -
 113
113 -
 114
114 -
 115
115 -
 116
116 -
 117
117 -
 118
118 -
 119
119 -
 120
120 -
 121
121 -
 122
122 -
 123
123 -
 124
124 -
 125
125 -
 126
126 -
 127
127 -
 128
128 -
 129
129 -
130
-
131
-
132
-
133
-
134
-
135
-
136
-
137
-
138
-
139
-
140
-
141
-
142
-
143
-
144
-
145
-
146
-
147
-
148
-
149
-
150
-
151
-
152
-
153
-
154
-
155
-
156
-
157
-
158
 |
 |

119
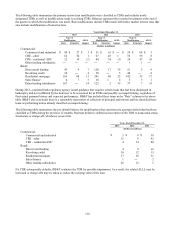
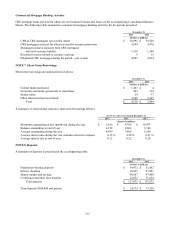
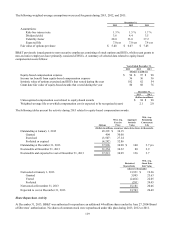
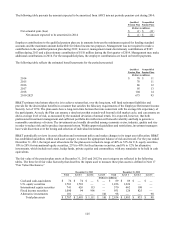
The following weighted-average assumptions were used for grants during 2013, 2012, and 2011:
December 31,
2013 2012 2011
Assumptions:
Risk-free interest rate 1.3 % 1.5 % 1.7 %
Dividend yield 3.6 4.4 3.5
Volatility factor 28.0 33.0 37.2
Expected life 7.0 yrs 7.0 yrs 7.4 yrs
Fair value of options per share $ 5.48 $ 6.07 $ 7.45
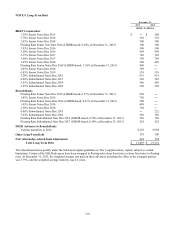
BB&T previously issued grants to non-executive employees consisting of stock options and RSUs, while recent grants to
non-executive employees have primarily consisted of RSUs. A summary of selected data related to equity-based
compensation costs follows:
Years Ended December 31,
2013 2012 2011
(Dollars in millions)
Equity-based compensation expense $ 96 $ 97 $ 98
Income tax benefit from equity-based compensation expense 36 36 36
Intrinsic value of options exercised and RSUs that vested during the year 102 62 54
Grant date fair value of equity-based awards that vested during the year 80 88 76
December 31,
2013 2012
(Dollars in millions)
Unrecognized compensation cost related to equity-based awards $ 94 $ 98
Weighted-average life over which compensation cost is expected to be recognized (years) 2.1 2.0
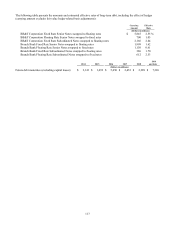
The following tables present the activity during 2013 related to equity-based compensation awards:
Wtd. Avg.
Wtd. Avg. Aggregate Remaining
Exercise Intrinsic Contractual
Options Price Value Life
(Dollars in millions, except per share data, shares in thousands)
Outstanding at January 1, 2013 45,391 $ 34.15
Granted 404 30.08
Exercised (3,507) 27.14
Forfeited or expired (4,292) 32.86
Outstanding at December 31, 2013 37,996 34.90 $ 140 3.7 yrs
Exercisable at December 31, 2013 31,354 36.32 80 2.9
Exercisable and expected to vest at December 31, 2013 37,513 34.99 136 3.7
Wtd. Avg.
Restricted Grant Date
Shares/Units Fair Value
(shares in thousands)
N
onvested at January 1, 2013 13,931 $ 19.26
Granted 3,995 25.63
Vested (2,464) 22.05
Forfeited (281) 20.45
N
onvested at December 31, 2013 15,181 20.46
Expected to vest at December 31, 2013 13,763 20.49
Share Repurchase Activity
At December 31, 2013, BB&T was authorized to repurchase an additional 44 million shares under the June 27, 2006 Board
of Directors’ authorization. No shares of common stock were repurchased under this plan during 2013, 2012 or 2011.