BB&T 2013 Annual Report Download - page 108
Download and view the complete annual report
Please find page 108 of the 2013 BB&T annual report below. You can navigate through the pages in the report by either clicking on the pages listed below, or by using the keyword search tool below to find specific information within the annual report.-
 1
1 -
2
-
3
-
4
-
5
-
6
-
7
-
8
-
9
-
10
-
11
-
12
-
13
-
14
-
15
-
16
-
17
-
18
-
19
-
20
-
21
-
22
-
23
-
24
-
25
-
26
-
27
-
28
-
29
-
30
-
31
-
32
-
33
-
34
-
35
-
36
-
37
-
38
-
39
-
40
-
41
-
42
-
43
-
44
-
45
-
46
-
47
-
48
-
49
-
50
-
51
-
52
-
53
-
54
-
55
-
56
-
57
-
58
-
59
-
60
-
61
-
62
-
63
-
64
-
65
-
66
-
67
-
68
-
69
-
70
-
71
-
72
-
73
-
74
-
75
-
76
-
77
-
78
-
79
-
80
-
81
-
82
-
83
-
84
-
85
-
86
-
87
-
88
-
89
-
90
-
91
-
92
-
93
-
94
-
95
-
96
-
97
-
 98
98 -
 99
99 -
 100
100 -
 101
101 -
 102
102 -
 103
103 -
 104
104 -
 105
105 -
 106
106 -
 107
107 -
 108
108 -
 109
109 -
 110
110 -
 111
111 -
 112
112 -
 113
113 -
 114
114 -
 115
115 -
 116
116 -
 117
117 -
 118
118 -
119
-
120
-
121
-
122
-
123
-
124
-
125
-
126
-
127
-
128
-
129
-
130
-
131
-
132
-
133
-
134
-
135
-
136
-
137
-
138
-
139
-
140
-
141
-
142
-
143
-
144
-
145
-
146
-
147
-
148
-
149
-
150
-
151
-
152
-
153
-
154
-
155
-
156
-
157
-
158
 |
 |

108
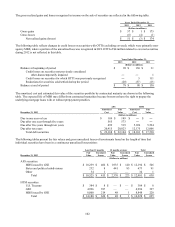
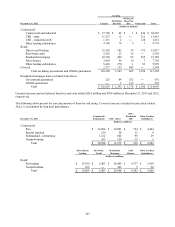
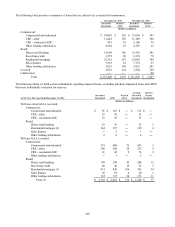
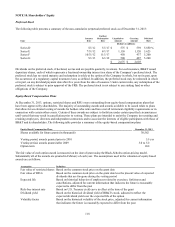
The following table provides a summary of loans that are collectively evaluated for impairment.
December 31, 2013 December 31, 2012
Recorded
Investment
Related
ALLL
Recorded
Investment
Related
ALLL
(Dollars in millions)
Commercial:
Commercial and industrial $ 38,042 $ 382 $ 37,664 $ 397
CRE - other 11,441 150 11,149 168
CRE - residential ADC 881 38 1,106 79
Other lending subsidiaries 4,501 15 4,135 12
Retail:
Direct retail lending 15,648 166 15,582 241
Revolving credit 2,355 96 2,274 78
Residential mortgage 23,316 167 23,085 198
Sales finance 9,363 41 7,714 23
Other lending subsidiaries 5,823 196 5,853 203
Covered 2,035 114 3,294 128
Unallocated ― ― ― 80
Total $ 113,405 $ 1,365 $ 111,856 $ 1,607
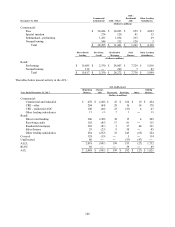
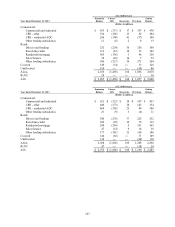
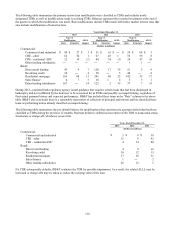
The following tables set forth certain information regarding impaired loans, excluding purchased impaired loans and LHFS,
that were individually evaluated for reserves.
Average Interest
Recorded Related Recorded Income
As Of / For The Year Ended December 31, 2013 Investment UPB ALLL Investment Recognized
(Dollars in millions)
With no related ALLL recorded:
Commercial:
Commercial and industrial $ 91 $ 165 $ ― $ 111 $ ―
CRE - other 25 41 ― 53 ―
CRE - residential ADC 16 36 ― 31 ―
Retail:
Direct retail lending 23 76 ― 23 1
Residential mortgage (1) 144 237 ― 129 4
Sales finance 1 2 ― 1 ―
Other lending subsidiaries 2 6 ― 4 ―
With an ALLL recorded:
Commercial:
Commercial and industrial 375 409 72 453 5
CRE - other 206 208 28 233 5
CRE - residential ADC 41 42 9 76 2
Other lending subsidiaries 1 1 ― 2 ―
Retail:
Direct retail lending 198 204 43 204 12
Revolving credit 48 48 19 52 2
Residential mortgage (1) 812 830 109 763 34
Sales finance 18 19 4 20 1
Other lending subsidiaries 135 137 28 173 11
Total (1) $ 2,136 $ 2,461 $ 312 $ 2,328 $ 77