BB&T 2013 Annual Report Download - page 44
Download and view the complete annual report
Please find page 44 of the 2013 BB&T annual report below. You can navigate through the pages in the report by either clicking on the pages listed below, or by using the keyword search tool below to find specific information within the annual report.-
 1
1 -
2
-
3
-
4
-
5
-
6
-
7
-
8
-
9
-
10
-
11
-
12
-
13
-
14
-
15
-
16
-
17
-
18
-
19
-
20
-
21
-
22
-
23
-
24
-
25
-
26
-
27
-
28
-
29
-
30
-
31
-
32
-
33
-
 34
34 -
 35
35 -
 36
36 -
 37
37 -
 38
38 -
 39
39 -
 40
40 -
 41
41 -
 42
42 -
 43
43 -
 44
44 -
 45
45 -
 46
46 -
 47
47 -
 48
48 -
 49
49 -
 50
50 -
 51
51 -
 52
52 -
 53
53 -
 54
54 -
55
-
56
-
57
-
58
-
59
-
60
-
61
-
62
-
63
-
64
-
65
-
66
-
67
-
68
-
69
-
70
-
71
-
72
-
73
-
74
-
75
-
76
-
77
-
78
-
79
-
80
-
81
-
82
-
83
-
84
-
85
-
86
-
87
-
88
-
89
-
90
-
91
-
92
-
93
-
94
-
95
-
96
-
97
-
98
-
99
-
100
-
101
-
102
-
103
-
104
-
105
-
106
-
107
-
108
-
109
-
110
-
111
-
112
-
113
-
114
-
115
-
116
-
117
-
118
-
119
-
120
-
121
-
122
-
123
-
124
-
125
-
126
-
127
-
128
-
129
-
130
-
131
-
132
-
133
-
134
-
135
-
136
-
137
-
138
-
139
-
140
-
141
-
142
-
143
-
144
-
145
-
146
-
147
-
148
-
149
-
150
-
151
-
152
-
153
-
154
-
155
-
156
-
157
-
158
 |
 |
44
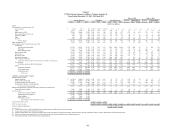
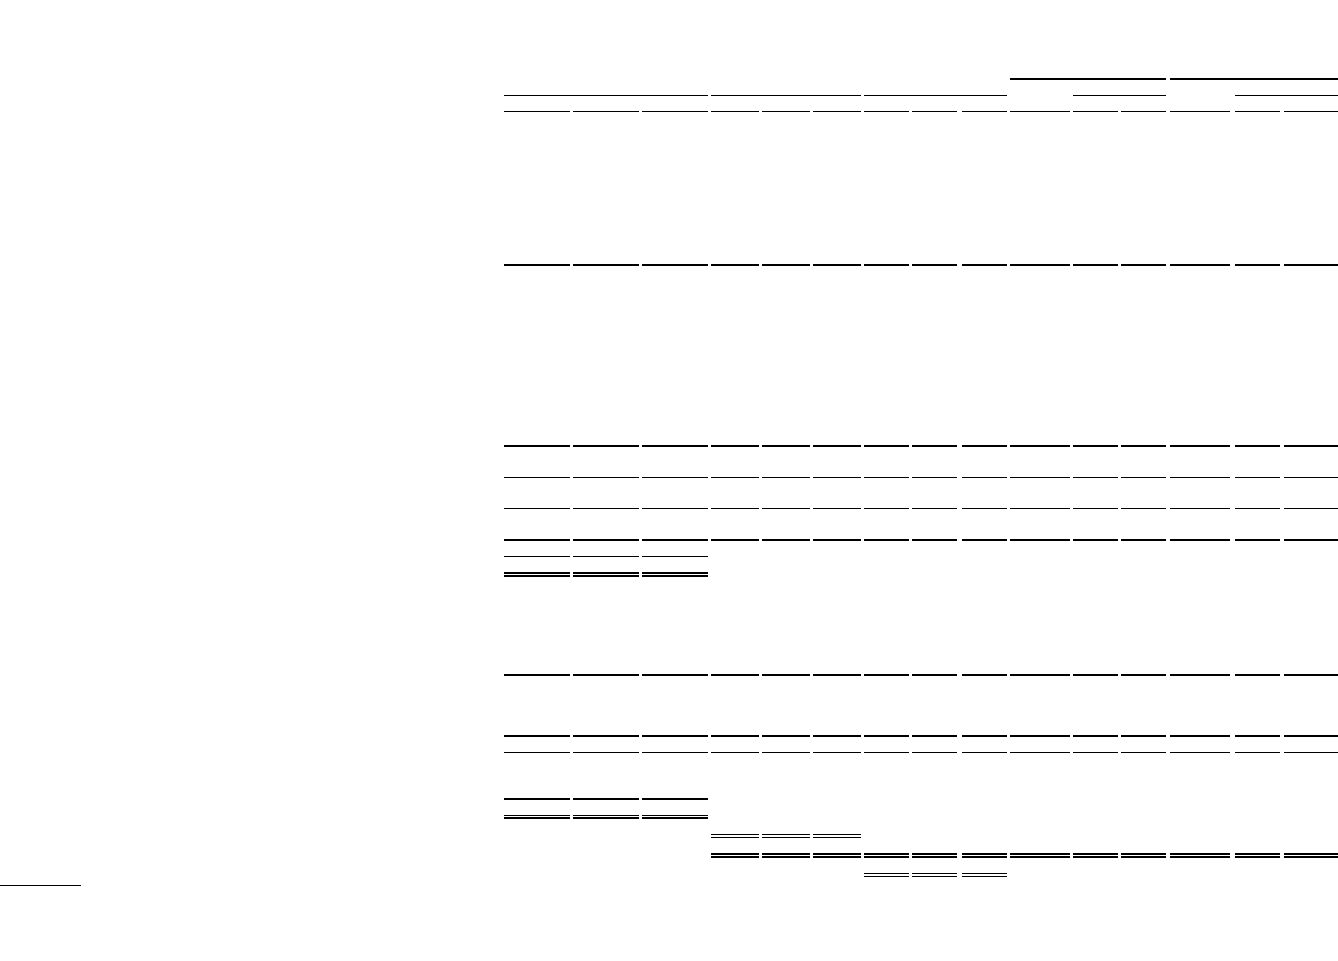
Table 11
FTE Net Interest Income and Rate / Volume Analysis (1)
Years Ended December 31, 2013, 2012 and 2011
2013 vs. 2012 2012 vs. 2011
Average Balances Yield/Rate Income/Expense Increase Change due to Increase Change due to
2013 2012 2011 2013 2012 2011 2013 2012 2011 (Decrease) Rate Volume (Decrease) Rate Volume
(Dollars in millions)
Assets
Total securities, at amortized cost: (2)
U.S. Treasuries $ 502 $ 272 $ 112 0.42 % 0.22 % 0.25 % $ 2 $ 1 $ ― $ 1 $ ― $ 1 $ 1 $ ― $ 1
GSEs 5,016 1,329 176 2.04 1.92 2.33 103 25 4 78 2 76 21 (1) 22
MBS issued by GSE 27,598 30,848 25,305 2.00 2.02 1.86 552 624 472 (72) (6) (66) 152 43 109
States and political subdivisions 1,836 1,851 1,895 5.80 5.83 5.72 107 108 109 (1) (1) ― (1) 2 (3)
N
on-agency MBS 283 346 528 5.69 5.76 6.72 16 20 35 (4) ― (4) (15) (5) (10)
Other 470 505 658 1.45 1.65 1.55 7 8 10 (1) ― (1) (2) 1 (3)
Covered 1,067 1,183 1,249 12.82 14.53 13.46 137 172 168 (35) (19) (16) 4 13 (9)
Total securities 36,772 36,334 29,923 2.51 2.64 2.67 924 958 798 (34) (24) (10) 160 53 107
Other earning assets (3) 2,412 3,359 3,207 1.39 0.91 0.62 34 31 20 3 13 (10) 11 10 1
Loans and leases, net of unearned income: (4)(5)
Commercial:
Commercial and industrial 38,206 36,966 34,153 3.63 3.96 4.23 1,386 1,464 1,446 (78) (126) 48 18 (96) 114
CRE-other 11,418 10,779 11,139 3.69 3.81 3.81 421 411 425 10 (13) 23 (14) ― (14)
CRE-residential ADC 1,087 1,665 2,769 4.34 3.76 3.51 47 63 97 (16) 9 (25) (34) 7 (41)
Direct retail lending 15,952 15,270 13,850 4.64 4.87 5.22 741 744 722 (3) (35) 32 22 (50) 72
Sales finance 8,658 7,680 7,202 3.18 3.97 4.88 275 305 352 (30) (66) 36 (47) (69) 22
Revolving credit 2,303 2,217 2,106 8.56 8.41 8.77 197 186 185 11 3 8 1 (8) 9
Residential mortgage 23,598 22,623 18,782 4.22 4.37 4.80 996 989 902 7 (35) 42 87 (86) 173
Other lending subsidiaries 10,468 9,525 8,280 10.20 11.04 11.51 1,068 1,051 953 17 (83) 100 98 (40) 138
Total loans and leases held for investment (excluding covered loans) 111,690 106,725 98,281 4.59 4.88 5.17 5,131 5,213 5,082 (82) (346) 264 131 (342) 473
Covered loans 2,667 4,045 5,498 16.93 18.91 19.15 451 765 1,053 (314) (74) (240) (288) (13) (275)
Total loans and leases held for investment 114,357 110,770 103,779 4.88 5.40 5.91 5,582 5,978 6,135 (396) (420) 24 (157) (355) 198
LHFS 3,170 2,963 2,183 3.59 3.42 3.75 114 101 82 13 5 8 19 (8) 27
Total loans and leases 117,527 113,733 105,962 4.85 5.35 5.87 5,696 6,079 6,217 (383) (415) 32 (138) (363) 225
Total earning assets 156,711 153,426 139,092 4.25 4.61 5.06 6,654 7,068 7,035 (414) (426) 12 33 (300) 333
N
onearning assets 24,551 25,208 23,874
Total assets $ 181,262 $ 178,634 $ 162,966
Liabilities and Shareholders’ Equity
Interest-bearing deposits:
Interest-checking $ 19,305 $ 19,904 $ 18,614 0.08 0.12 0.16 15 25 30 (10) (9) (1) (5) (7) 2
Money market and savings 48,640 46,927 41,287 0.13 0.18 0.31 64 85 129 (21) (24) 3 (44) (60) 16
Certificates and other time deposits 26,006 31,647 28,825 0.85 1.01 1.57 221 319 453 (98) (46) (52) (134) (175) 41
Foreign office deposits - interest-bearing 672 214 647 0.08 0.11 (0.37) 1 ― (2) 1 ― 1 2 1 1
Total interest-bearing deposits 94,623 98,692 89,373 0.32 0.43 0.68 301 429 610 (128) (79) (49) (181) (241) 60
Federal funds purchased, securities sold under repurchase agreements and
short-term borrowed funds 4,459 3,408 5,189 0.16 0.26 0.27 7 9 14 (2) (4) 2 (5) (1) (4)
Long-term debt 19,301 20,651 22,257 3.03 3.02 3.40 584 624 757 (40) 2 (42) (133) (81) (52)
Total interest-bearing liabilities 118,383 122,751 116,819 0.75 0.86 1.18 892 1,062 1,381 (170) (81) (89) (319) (323) 4
N
oninteres
t
-bearing deposits 33,932 28,925 22,945
Other liabilities 7,057 7,481 5,935
Shareholders’ equity 21,890 19,477 17,267
Total liabilities and shareholders’ equity $ 181,262 $ 178,634 $ 162,966
Average interest rate spread 3.50 % 3.75 % 3.88 %
N
IM/ net interest income 3.68 % 3.91 % 4.06 % $ 5,762 $ 6,006 $ 5,654 $ (244) $ (345) $ 101 $ 352 $ 23 $ 329
Taxable-equivalent adjustment $ 146 $ 149 $ 147
(1) Yields are stated on a taxable equivalent basis assuming tax rates in effect for the periods presented.
(2) Total securities include AFS and HTM securities.
(3) Includes Federal funds sold, securities purchased under resale agreements or similar arrangements, interest-bearing deposits with banks, trading securities, FHLB stock and other earning assets.
(4) Loan fees, which are not material for any of the periods shown, have been included for rate calculation purposes.
(5)
N
onaccrual loans have been included in the average balances.